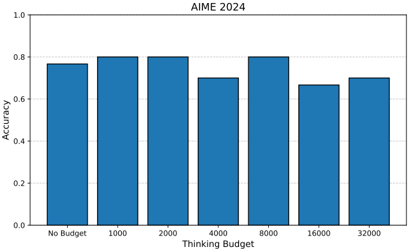
## Bar Chart: AIME 2024 Accuracy vs. Thinking Budget
### Overview
The image is a bar chart displaying the accuracy of a model (presumably for AIME 2024) against different "Thinking Budget" values. The x-axis represents the thinking budget, and the y-axis represents accuracy.
### Components/Axes
* **Title:** AIME 2024
* **X-axis:** Thinking Budget
* Categories: No Budget, 1000, 2000, 4000, 8000, 16000, 32000
* **Y-axis:** Accuracy
* Scale: 0.0 to 1.0, with increments of 0.2 (0.0, 0.2, 0.4, 0.6, 0.8, 1.0)
* **Bars:** Blue bars represent the accuracy for each thinking budget.
### Detailed Analysis
Here's a breakdown of the accuracy for each thinking budget:
* **No Budget:** Accuracy is approximately 0.77.
* **1000:** Accuracy is approximately 0.80.
* **2000:** Accuracy is approximately 0.80.
* **4000:** Accuracy is approximately 0.70.
* **8000:** Accuracy is approximately 0.80.
* **16000:** Accuracy is approximately 0.67.
* **32000:** Accuracy is approximately 0.70.
### Key Observations
* The accuracy is highest at thinking budgets of 1000, 2000, and 8000, all around 0.80.
* The accuracy is lowest at a thinking budget of 16000, at approximately 0.67.
* There is no clear linear relationship between the thinking budget and accuracy. Increasing the thinking budget does not consistently improve accuracy.
### Interpretation
The chart suggests that there is an optimal "Thinking Budget" for this model's performance on the AIME 2024 task. Simply increasing the budget does not guarantee better accuracy. In fact, beyond a certain point (around 8000), increasing the budget seems to decrease performance. The model performs best with a thinking budget of 1000, 2000, or 8000. The "No Budget" case performs reasonably well, suggesting a baseline level of accuracy without any specific computational allocation. The drop in accuracy at 16000 and 32000 could indicate overfitting or inefficient use of the allocated budget at higher values.