## Bar Chart: AIME 2024 Accuracy vs. Thinking Budget
### Overview
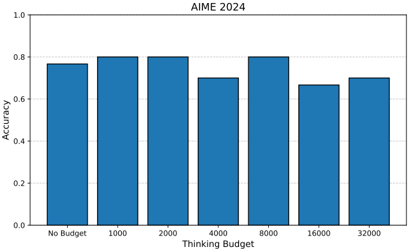
The chart visualizes the relationship between "Thinking Budget" (x-axis) and "Accuracy" (y-axis) for the AIME 2024 dataset. Seven categories of thinking budgets are compared, with accuracy values ranging from 0.0 to 1.0. All bars are colored blue, and the chart emphasizes performance trends across budget tiers.
### Components/Axes
- **Title**: "AIME 2024" (top-center).
- **X-Axis**: Labeled "Thinking Budget" with categories:
- No Budget
- 1000
- 2000
- 4000
- 8000
- 16000
- 32000
- **Y-Axis**: Labeled "Accuracy" with a linear scale from 0.0 to 1.0 in increments of 0.2.
- **Legend**: Not explicitly visible in the image, but implied by the uniform blue color of all bars.
- **Bars**: Positioned above each x-axis category, with heights proportional to accuracy values.
### Detailed Analysis
- **No Budget**: Accuracy ≈ 0.75 (bar height ~75% of y-axis).
- **1000**: Accuracy ≈ 0.80 (bar height ~80%).
- **2000**: Accuracy ≈ 0.80 (bar height ~80%).
- **4000**: Accuracy ≈ 0.70 (bar height ~70%).
- **8000**: Accuracy ≈ 0.80 (bar height ~80%).
- **16000**: Accuracy ≈ 0.65 (bar height ~65%).
- **32000**: Accuracy ≈ 0.70 (bar height ~70%).
### Key Observations
1. **Peaks at Lower Budgets**: The highest accuracy (0.80) occurs at 1000 and 2000 budgets, suggesting optimal performance in this range.
2. **Dip at 4000**: A noticeable drop to 0.70 at 4000, indicating reduced efficiency compared to lower budgets.
3. **Recovery at 8000**: Accuracy rebounds to 0.80 at 8000, matching the performance of 1000/2000.
4. **Decline at 16000**: A sharp drop to 0.65 at 16000, the lowest observed value.
5. **Moderate Recovery at 32000**: Accuracy improves slightly to 0.70 but remains below the 8000 budget peak.
### Interpretation
The data suggests that increasing the thinking budget does not linearly correlate with accuracy. Instead, there is an optimal range (1000–2000) where performance is maximized. Beyond this range, accuracy fluctuates unpredictably, with a significant drop at 16000 and only partial recovery at 32000. This pattern may indicate diminishing returns, resource allocation inefficiencies, or non-linear dependencies in the AIME 2024 system. The absence of a clear upward trend at higher budgets challenges assumptions that larger budgets always improve outcomes, highlighting the need for further investigation into cost-effectiveness thresholds.