# Technical Data Extraction: Performance vs. Effective Context Length
## 1. Component Isolation
* **Header/Legend:** Located in the top-left quadrant. Contains three identifiers.
* **Main Chart Area:** A scatter/line plot with a logarithmic X-axis and linear Y-axis. It features a dense collection of semi-transparent lines and a series of highlighted red data points.
* **Axes:**
* **Y-Axis (Vertical):** Labeled "Normalized Performance". Range: -3 to 3.
* **X-Axis (Horizontal):** Labeled "Effective Context Length". Logarithmic scale ranging from $10^2$ to approximately $5 \times 10^6$.
## 2. Legend and Label Extraction
* **Legend Location:** [x=0.05, y=0.85] (Top-left corner).
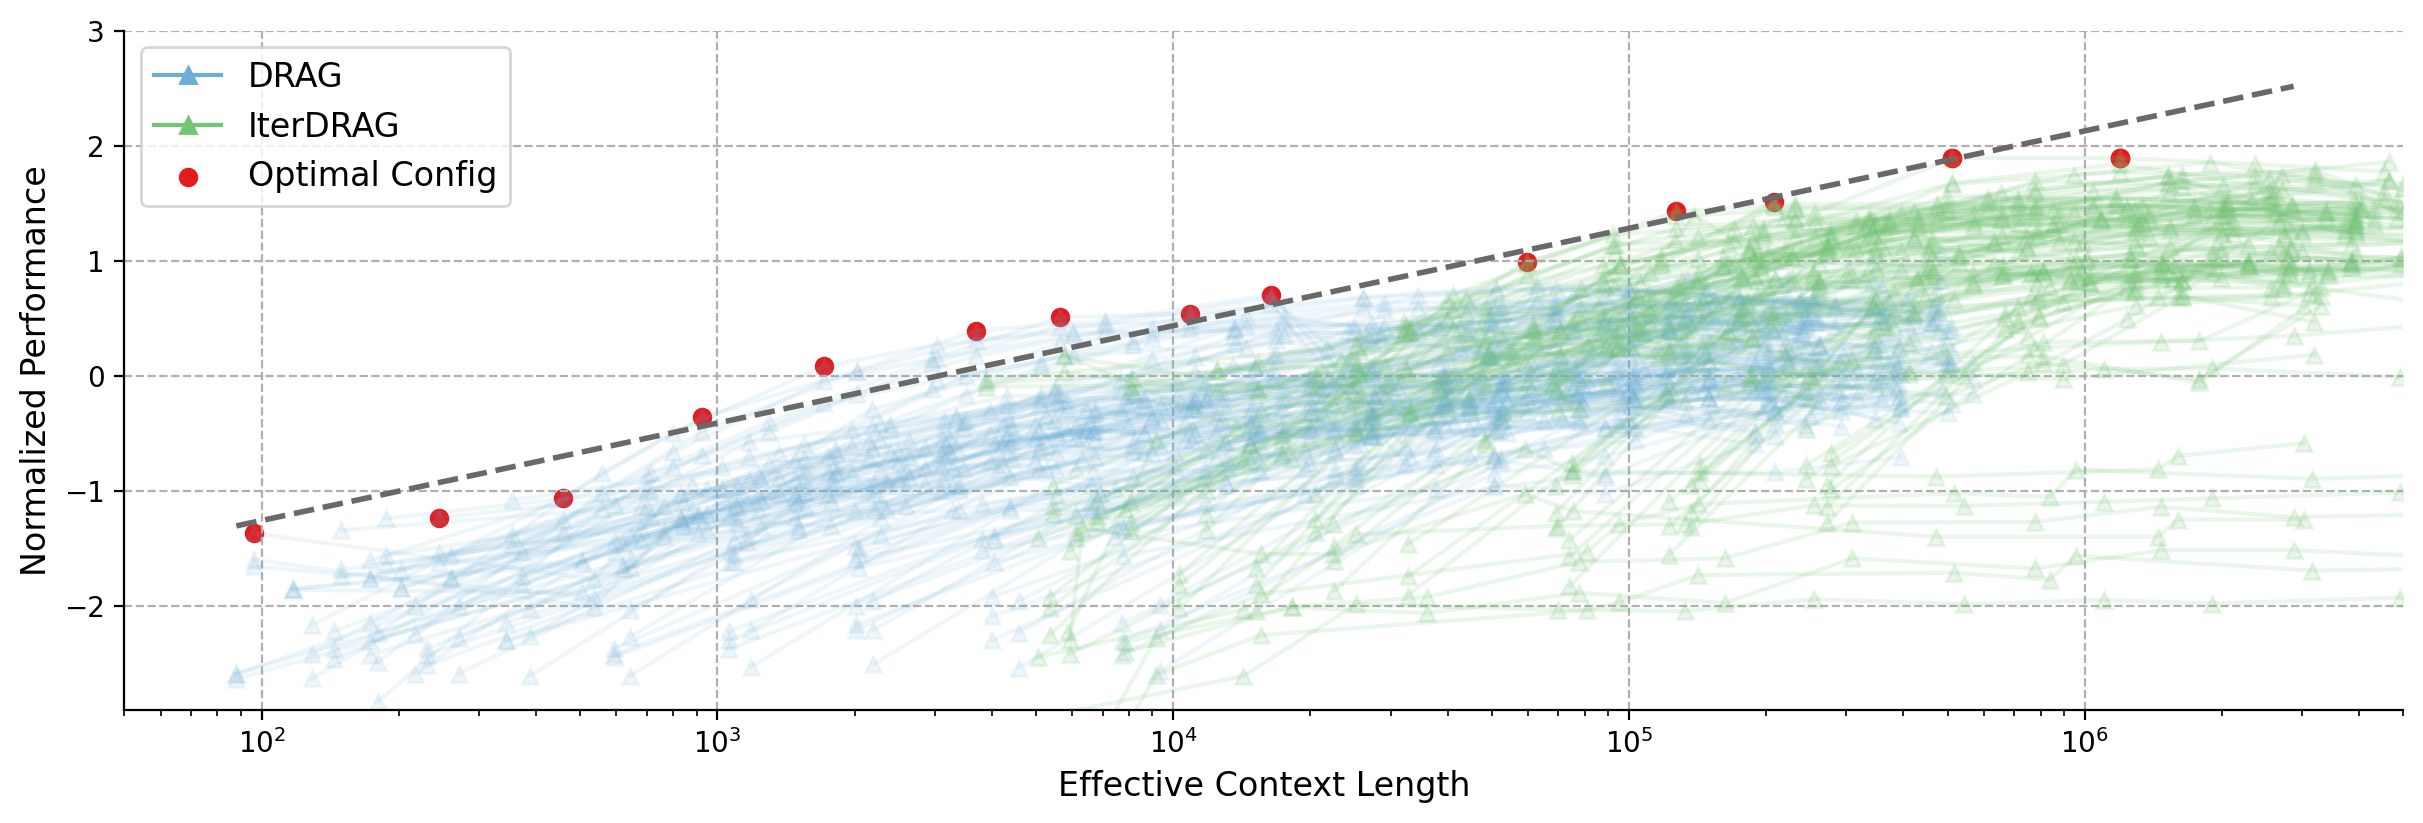
* **DRAG (Blue Triangle):** Represented by light blue lines with triangular markers.
* **IterDRAG (Green Triangle):** Represented by light green lines with triangular markers.
* **Optimal Config (Red Circle):** Represented by solid red circular points.
* **Dashed Grey Line:** (Unlabeled in legend) Represents the upper frontier or trend line of the optimal configurations.
## 3. Data Series Analysis and Trend Verification
### Series 1: DRAG (Blue Lines)
* **Visual Trend:** These lines generally occupy the lower-left to middle-right section of the graph. They show a positive correlation between context length and performance, but they saturate or plateau earlier than the green series, generally staying below a Normalized Performance of 1.0.
* **Range:** Predominantly active between $10^2$ and $5 \times 10^5$ Effective Context Length.
### Series 2: IterDRAG (Green Lines)
* **Visual Trend:** These lines begin appearing prominently around $5 \times 10^3$ context length. They slope upward more aggressively than the blue series at higher context lengths, reaching higher Normalized Performance values (up to ~2.0).
* **Range:** Predominantly active between $5 \times 10^3$ and $5 \times 10^6$ Effective Context Length.
### Series 3: Optimal Config (Red Dots)
* **Visual Trend:** These points track the maximum performance achieved at various context lengths. They follow a logarithmic upward trajectory, closely tracked by a dashed grey trend line.
* **Key Data Points (Approximate):**
* $10^2$: ~ -1.4
* $5 \times 10^2$: ~ -1.1
* $10^3$: ~ -0.4
* $5 \times 10^3$: ~ +0.4
* $10^4$: ~ +0.5
* $10^5$: ~ +1.4
* $5 \times 10^5$: ~ +1.9
* $10^6$: ~ +1.9
## 4. Structural Data Representation
| Effective Context Length (X) | Approx. Max Normalized Performance (Y) | Dominant Method at Frontier |
| :--- | :--- | :--- |
| $10^2$ | -1.4 | DRAG (Blue) |
| $10^3$ | -0.4 | DRAG (Blue) |
| $10^4$ | +0.5 | Transition (Blue/Green) |
| $10^5$ | +1.4 | IterDRAG (Green) |
| $10^6$ | +1.9 | IterDRAG (Green) |
## 5. Technical Summary
The chart illustrates the scaling behavior of two methods, **DRAG** and **IterDRAG**, regarding **Normalized Performance** as **Effective Context Length** increases.
1. **Scaling:** There is a clear logarithmic scaling law, indicated by the dashed grey line, where performance increases as context length grows.
2. **Method Superiority:** DRAG (blue) is the primary contributor to performance at shorter context lengths ($< 10^4$). IterDRAG (green) becomes the superior method for high-context scenarios ($> 10^4$), achieving the highest overall performance scores.
3. **Saturation:** Performance appears to begin leveling off as it approaches $10^6$ context length, with the "Optimal Config" points clustering around a Normalized Performance value of 2.0.