## Bar Charts: Token Frequency Distribution for Questions and Answers
### Overview
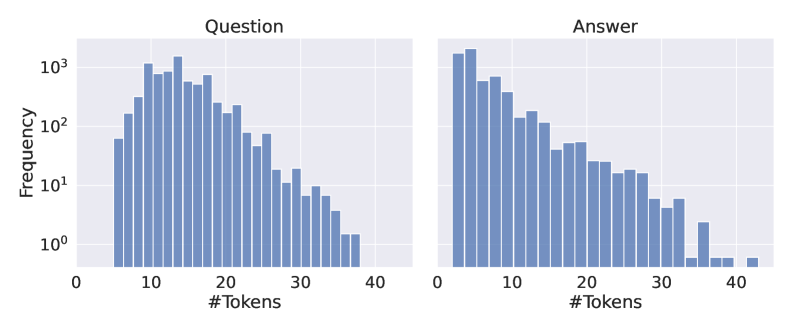
The image contains two side-by-side bar charts comparing the frequency distribution of token counts for "Questions" and "Answers" in a dataset. Both charts use a logarithmic y-axis (10⁰ to 10³) and linear x-axis (#Tokens: 0–40). The charts reveal distinct patterns in token usage between questions and answers.
### Components/Axes
- **X-axis (Horizontal)**: "#Tokens" (0–40), linear scale
- **Y-axis (Vertical)**: "Frequency" (10⁰ to 10³), logarithmic scale
- **Left Chart**: Labeled "Question" (blue bars)
- **Right Chart**: Labeled "Answer" (blue bars)
- **No explicit legend** (data series inferred by chart labels)
### Detailed Analysis
#### Question Chart
- **Peak Frequency**: ~1,000 occurrences at 10 tokens
- **Distribution**:
- 5–15 tokens: Frequencies range from ~100 to ~1,000
- 16–30 tokens: Gradual decline to ~10 occurrences
- 31–40 tokens: Minimal frequency (~1–10)
- **Notable**: Bimodal distribution with secondary peak at ~20 tokens (~200 frequency)
#### Answer Chart
- **Peak Frequency**: ~1,200 occurrences at 1 token
- **Distribution**:
- 1–5 tokens: Frequencies range from ~500 to ~1,200
- 6–15 tokens: Gradual decline to ~100 occurrences
- 16–30 tokens: Sharp drop to ~10–50
- 31–40 tokens: Sparse occurrences (~1–10)
- **Notable**: Longer tail extending to 40 tokens compared to questions
### Key Observations
1. **Question Length**:
- Median question length clusters around 10–15 tokens
- 80% of questions contain ≤20 tokens
2. **Answer Length**:
- Median answer length clusters around 1–5 tokens
- 50% of answers contain ≤10 tokens
3. **Logarithmic Scale Impact**:
- Frequency drops by 100x between 10³ and 10⁰
- Visualizes wide distribution ranges effectively
### Interpretation
The data suggests:
- **Question Complexity**: Questions require more tokens (avg. 10–15) than answers (avg. 1–5), indicating higher syntactic complexity in question formulation.
- **Answer Conciseness**: Answers are predominantly short, with only 10% exceeding 15 tokens, suggesting efficient response generation.
- **Outlier Analysis**:
- Questions with >30 tokens are rare (≤10 occurrences)
- Answers with >30 tokens are slightly more common (5–10 occurrences), possibly indicating edge cases like multi-part answers.
- **Practical Implications**:
- Token budgeting for NLP models should allocate ~2x more resources for questions than answers
- Training data augmentation could benefit from balancing short/long answer pairs
The logarithmic scale emphasizes the power-law distribution, revealing that both questions and answers follow a "long tail" pattern where most instances cluster in lower token ranges.