# Technical Document Extraction: Student Familiarity with Quantum Concepts
## Chart Overview
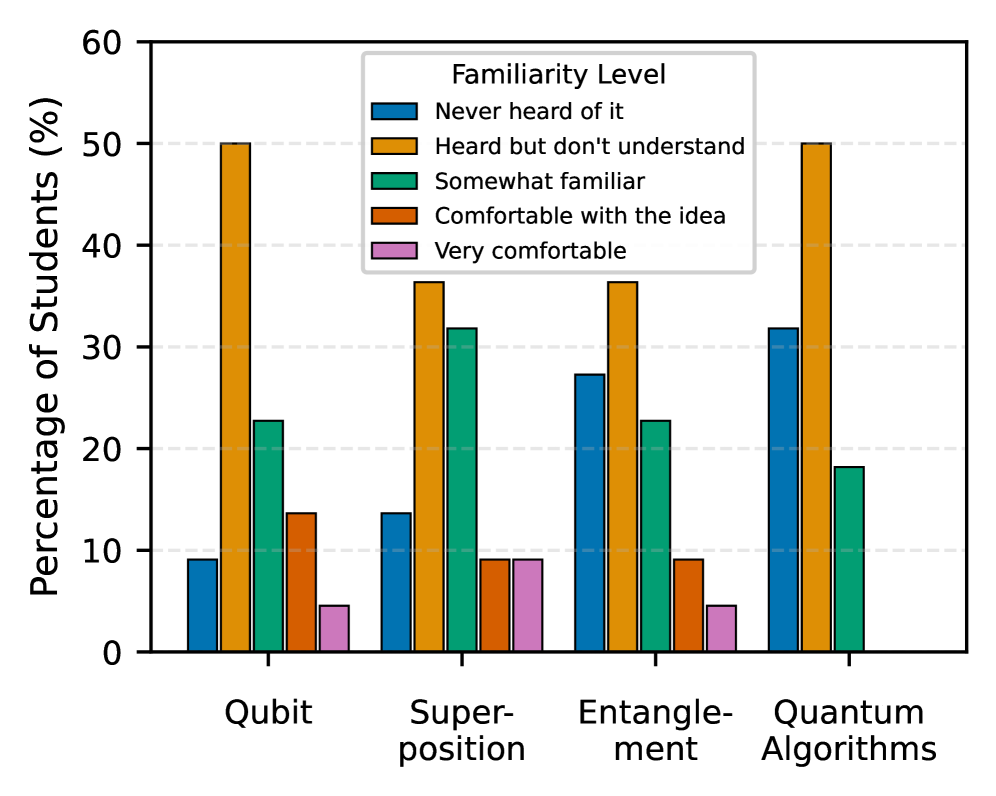
This bar chart visualizes student familiarity levels with four quantum computing concepts: Qubit, Superposition, Entanglement, and Quantum Algorithms. The y-axis represents percentage of students (0-60%), while the x-axis categorizes the quantum concepts.
## Legend Analysis
Legend located at [x: 0.85, y: 0.95] (top-right corner) with five familiarity levels:
1. **Never heard of it** (blue)
2. **Heard but don't understand** (orange)
3. **Somewhat familiar** (green)
4. **Comfortable with the idea** (red)
5. **Very comfortable** (purple)
## Data Extraction & Trend Verification
### Qubit
- **Orange (Heard but don't understand)**: 50% (highest bar)
- **Green (Somewhat familiar)**: 23%
- **Red (Comfortable)**: 14%
- **Blue (Never heard)**: 10%
- **Purple (Very comfortable)**: 5%
### Superposition
- **Orange (Heard but don't understand)**: 37%
- **Green (Somewhat familiar)**: 32% (peak)
- **Red (Comfortable)**: 9%
- **Blue (Never heard)**: 14%
- **Purple (Very comfortable)**: 9%
### Entanglement
- **Orange (Heard but don't understand)**: 37%
- **Green (Somewhat familiar)**: 23%
- **Red (Comfortable)**: 9%
- **Blue (Never heard)**: 28%
- **Purple (Very comfortable)**: 5%
### Quantum Algorithms
- **Orange (Heard but don't understand)**: 50% (peak)
- **Green (Somewhat familiar)**: 18%
- **Blue (Never heard)**: 32% (peak)
- **Red (Comfortable)**: 0% (no bar)
- **Purple (Very comfortable)**: 0% (no bar)
## Key Observations
1. **Highest Familiarity**: "Heard but don't understand" dominates all categories (45-50% range)
2. **Lowest Comfort**: "Very comfortable" never exceeds 9% across all concepts
3. **Quantum Algorithms Paradox**: Highest "Never heard" (32%) despite being the most advanced concept
4. **Consistent Pattern**: "Somewhat familiar" decreases from 32% (Superposition) to 18% (Quantum Algorithms)
## Spatial Grounding
- Legend occupies top-right quadrant (85% width, 95% height)
- Data bars clustered in descending order of familiarity levels
- No overlapping bars between categories
## Missing Data
- No values for "Comfortable" and "Very comfortable" in Quantum Algorithms category
- No textual annotations present in the chart
## Technical Specifications
- Chart type: Grouped bar chart
- Color scheme: Qualitative (distinct colors for each category)
- Axis labels:
- X: Quantum Concepts (categorical)
- Y: Percentage of Students (%)
- Data range: 0-60% on y-axis
- Bar width: Uniform across all categories