# Roofline Model Analysis (Llama 7B, A40)
## Graph Structure
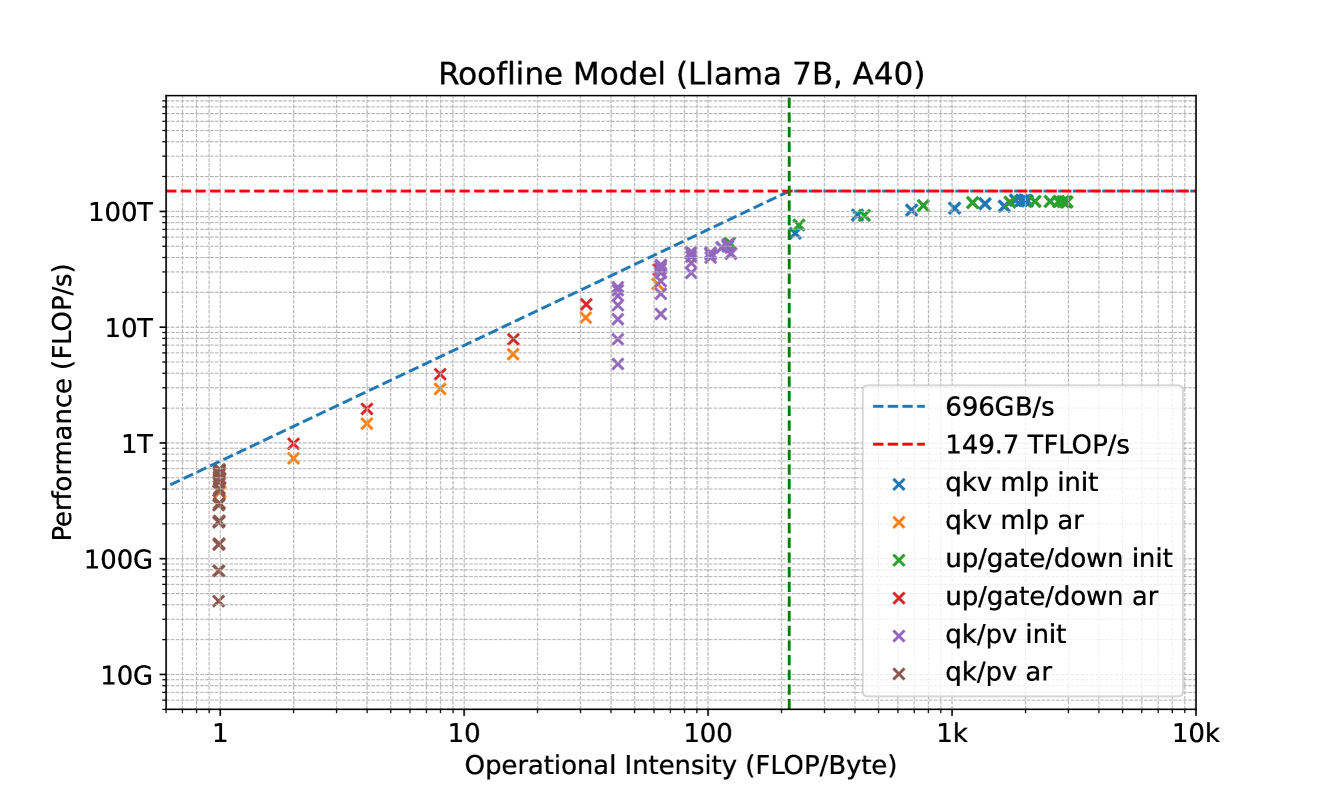
- **Title**: Roofline Model (Llama 7B, A40)
- **X-Axis**: Operational Intensity (FLOP/Byte)
- Logarithmic scale from 1 to 10,000 (10k)
- **Y-Axis**: Performance (FLOP/s)
- Logarithmic scale from 10G (10^9) to 100T (10^14)
## Key Thresholds
1. **Blue Dashed Line**: 696GB/s (Memory bandwidth limit)
2. **Red Dashed Line**: 149.7 TFLOP/s (Theoretical peak performance)
3. **Green Dashed Line**: 100 TFLOP/s (Critical performance threshold)
## Legend Entries
| Symbol | Label | Color |
|--------|------------------------|--------|
| `x` | qkv mlp init | Blue |
| `x` | qkv mlp ar | Orange |
| `x` | up/gate/down init | Green |
| `x` | up/gate/down ar | Red |
| `x` | qk/pv init | Purple |
| `x` | qk/pv ar | Brown |
## Data Trends
1. **Performance Scaling**:
- All operations follow the roofline model, with performance increasing linearly with operational intensity until hitting memory bandwidth limits (696GB/s).
- Beyond 100 TFLOP/s (green line), performance plateaus due to hardware constraints.
2. **Operation-Specific Performance**:
- **qkv mlp init** (blue `x`): Reaches ~100T FLOP/s at ~100 TFLOP/Byte intensity.
- **qkv mlp ar** (orange `x`): Peaks near 10T FLOP/s at ~10 TFLOP/Byte.
- **up/gate/down init** (green `x`): Exceeds 100T FLOP/s at ~1k TFLOP/Byte.
- **up/gate/down ar** (red `x`): Crosses 100T FLOP/s at ~100 TFLOP/Byte.
- **qk/pv init** (purple `x`): Achieves ~10T FLOP/s at ~10 TFLOP/Byte.
- **qk/pv ar** (brown `x`): Remains below 10G FLOP/s across all intensities.
3. **Critical Observations**:
- Operations with "init" suffixes generally achieve higher performance than their "ar" counterparts.
- The 100 TFLOP/s threshold (green line) acts as a performance ceiling for most operations.
- Memory-bound operations (e.g., up/gate/down init) dominate at high operational intensities.
## Technical Implications
- The roofline model illustrates the trade-off between computational intensity and memory bandwidth.
- Optimizing for higher operational intensity (FLOP/Byte) is critical to approach the 149.7 TFLOP/s theoretical limit.
- Memory-bound operations (e.g., up/gate/down init) are bottlenecked by the 696GB/s memory bandwidth.