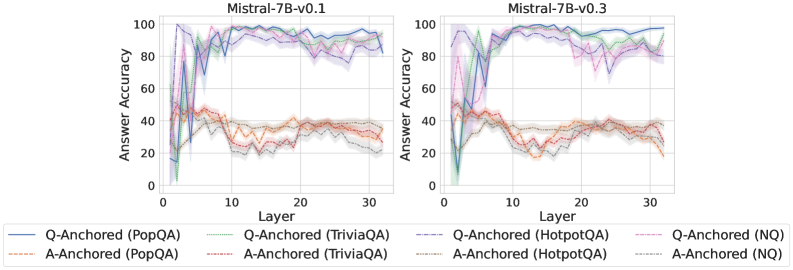
## Line Charts: Mistral-7B Model Layer-wise Answer Accuracy by Anchoring Method and Dataset
### Overview
The image displays two side-by-side line charts comparing the "Answer Accuracy" across model layers (0-30) for two versions of the Mistral-7B model: **Mistral-7B-v0.1** (left chart) and **Mistral-7B-v0.3** (right chart). Each chart plots the performance of eight different experimental conditions, defined by a combination of an anchoring method (Q-Anchored or A-Anchored) and a question-answering dataset (PopQA, TriviaQA, HotpotQA, NQ). The charts include shaded regions around each line, likely representing confidence intervals or standard deviation.
### Components/Axes
* **Chart Titles:** "Mistral-7B-v0.1" (left), "Mistral-7B-v0.3" (right).
* **Y-Axis:** Labeled "Answer Accuracy". Scale runs from 0 to 100 in increments of 20.
* **X-Axis:** Labeled "Layer". Scale runs from 0 to 30 in increments of 10.
* **Legend:** Positioned below both charts. Contains 8 entries, each with a unique line style and color:
1. `Q-Anchored (PopQA)`: Solid blue line.
2. `A-Anchored (PopQA)`: Dashed orange line.
3. `Q-Anchored (TriviaQA)`: Solid green line.
4. `A-Anchored (TriviaQA)`: Dashed red line.
5. `Q-Anchored (HotpotQA)`: Solid purple line.
6. `A-Anchored (HotpotQA)`: Dashed brown line.
7. `Q-Anchored (NQ)`: Solid pink line.
8. `A-Anchored (NQ)`: Dashed gray line.
### Detailed Analysis
**General Trend Across Both Charts:**
* **Q-Anchored Methods (Solid Lines):** These lines consistently achieve higher accuracy than their A-Anchored counterparts. They typically start low (near 0-20% at Layer 0), rise sharply within the first 5-10 layers to a high plateau (often between 80-100%), and maintain relatively high accuracy through Layer 30, with some fluctuations.
* **A-Anchored Methods (Dashed Lines):** These lines show significantly lower accuracy. They often start around 40-50% at Layer 0, exhibit high volatility (sharp peaks and troughs) in the early layers (0-10), and then generally trend downward or stabilize at a lower level (approximately 20-40%) in the later layers (10-30).
**Mistral-7B-v0.1 (Left Chart) Specifics:**
* **Q-Anchored (PopQA - Blue):** Rises steeply to ~95% by Layer 5, peaks near 100% around Layer 10, and remains high (~90-95%) thereafter.
* **Q-Anchored (TriviaQA - Green):** Follows a similar steep rise, reaching ~95% by Layer 5, but shows more volatility in the mid-layers (10-20) before stabilizing near 90%.
* **Q-Anchored (HotpotQA - Purple):** Rises to ~90% by Layer 5, dips slightly around Layer 15, then recovers to ~90%.
* **Q-Anchored (NQ - Pink):** Shows the most volatile rise among Q-Anchored lines, reaching ~90% by Layer 5 but with significant dips, notably around Layer 3 and Layer 15.
* **A-Anchored Lines:** All start between 40-50%. They show a general downward trend after Layer 10, converging into a band between ~20-40% by Layer 30. `A-Anchored (TriviaQA - Red)` appears to be the lowest-performing series in the later layers.
**Mistral-7B-v0.3 (Right Chart) Specifics:**
* **Q-Anchored Methods:** The overall pattern is similar to v0.1, but the rise to high accuracy appears slightly more consistent and less volatile in the very early layers (0-5). The plateau accuracy levels are comparable (80-100%).
* **A-Anchored Methods:** The downward trend after the initial layers is more pronounced. By Layer 30, most A-Anchored lines are clustered tightly between ~20-35%, with `A-Anchored (TriviaQA - Red)` again appearing among the lowest.
### Key Observations
1. **Dominant Performance Gap:** The most striking feature is the large and consistent performance gap between Q-Anchored (solid lines) and A-Anchored (dashed lines) methods across all datasets and both model versions. Q-Anchored methods are vastly superior.
2. **Layer Sensitivity:** Q-Anchored performance improves dramatically with depth in the early layers (0-10) and then stabilizes. A-Anchored performance is highly unstable in early layers and degrades or stagnates in later layers.
3. **Dataset Variability:** While the Q-Anchored vs. A-Anchored pattern holds for all datasets, there is variability in the exact accuracy levels and volatility. For example, `Q-Anchored (NQ)` shows more dips than `Q-Anchored (PopQA)`.
4. **Model Version Similarity:** The overall trends and relative performance of the methods are remarkably consistent between Mistral-7B-v0.1 and v0.3, suggesting the observed phenomenon is robust to this version update.
### Interpretation
This data strongly suggests that the **anchoring strategy** (framing the model's internal processing around the question vs. the answer) is a critical factor influencing the accuracy of the Mistral-7B model across its layers.
* **Q-Anchoring is Highly Effective:** Processing information anchored to the question leads to high accuracy that develops early in the network (first 10 layers) and is maintained. This implies the model's middle and later layers are well-optimized for question-centric reasoning.
* **A-Anchoring is Detrimental:** Anchoring to the answer appears to confuse or misdirect the model's processing. The initial volatility suggests instability in early feature extraction, and the subsequent decline indicates that deeper layers cannot effectively build upon this flawed foundation. It may force the model into a less natural or more constrained processing path.
* **Practical Implication:** For tasks using these models (like retrieval-augmented generation or question answering), system prompts or architectural designs that encourage the model to "think from the question" (Q-Anchored) are likely to yield significantly better results than those that start from or emphasize the answer (A-Anchored).
* **Underlying Mechanism:** The charts provide empirical evidence for a specific form of **layer-wise specialization** in LLMs. The early layers (0-10) appear to be crucial for establishing the correct "frame" (question-anchored), which then enables stable, high-performance reasoning in subsequent layers. An incorrect frame (answer-anchored) leads to a cascade of errors.