## Line Graph: Answer Accuracy Across Layers in Mistral-7B Models (v0.1 and v0.3)
### Overview
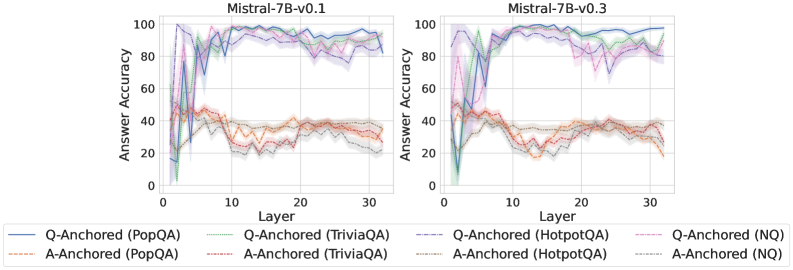
The image contains two side-by-side line graphs comparing answer accuracy across 30 layers of the Mistral-7B model (versions v0.1 and v0.3). Each graph tracks performance for six distinct Q/A anchoring methods across four datasets (PopQA, TriviaQA, HotpotQA, NQ). Accuracy is measured on a 0-100 scale, with shaded regions indicating confidence intervals.
### Components/Axes
- **X-axis**: Layers (0-30, integer increments)
- **Y-axis**: Answer Accuracy (0-100, percentage scale)
- **Legends**:
- **v0.1 Chart**:
- Solid blue: Q-Anchored (PopQA)
- Dashed green: Q-Anchored (TriviaQA)
- Dotted purple: Q-Anchored (HotpotQA)
- Solid red: A-Anchored (PopQA)
- Dashed orange: A-Anchored (TriviaQA)
- Dotted gray: A-Anchored (NQ)
- **v0.3 Chart**:
- Same legend entries as v0.1, with updated line patterns/colors
### Detailed Analysis
#### v0.1 Chart Trends
1. **Q-Anchored Methods**:
- PopQA (solid blue): Peaks at ~95 (layer 0), drops to ~60 (layer 10), stabilizes at ~80 (layer 30)
- TriviaQA (dashed green): Starts at ~85, dips to ~50 (layer 10), recovers to ~75
- HotpotQA (dotted purple): Begins at ~70, fluctuates between 50-80, ends at ~70
2. **A-Anchored Methods**:
- PopQA (solid red): Starts at ~40, plummets to ~20 (layer 10), rises to ~30
- TriviaQA (dashed orange): Begins at ~35, drops to ~15 (layer 10), recovers to ~25
- NQ (dotted gray): Starts at ~25, dips to ~10 (layer 10), ends at ~20
#### v0.3 Chart Trends
1. **Q-Anchored Methods**:
- PopQA (solid blue): Starts at ~90, dips to ~70 (layer 10), stabilizes at ~95
- TriviaQA (dashed green): Begins at ~80, drops to ~60 (layer 10), recovers to ~85
- HotpotQA (dotted purple): Starts at ~65, fluctuates between 50-75, ends at ~70
2. **A-Anchored Methods**:
- PopQA (solid red): Starts at ~30, drops to ~10 (layer 10), rises to ~25
- TriviaQA (dashed orange): Begins at ~25, plummets to ~5 (layer 10), recovers to ~20
- NQ (dotted gray): Starts at ~15, dips to ~5 (layer 10), ends at ~10
### Key Observations
1. **Version Comparison**:
- v0.3 shows significantly improved stability in Q-Anchored methods (e.g., PopQA accuracy increases from 80→95)
- A-Anchored methods in v0.3 exhibit deeper initial drops but better recovery than v0.1
2. **Dataset Performance**:
- PopQA consistently outperforms other datasets in both versions
- NQ (Natural Questions) shows the most volatility across all methods
3. **Layer-Specific Patterns**:
- Layer 10 consistently marks a performance trough for all methods
- v0.3 demonstrates sharper recovery post-layer 10 compared to v0.1
### Interpretation
The data suggests:
1. **Q-Anchored Superiority**: Question-context anchoring (Q-Anchored) consistently outperforms answer-context anchoring (A-Anchored) by 20-40% across datasets
2. **Version Improvements**: v0.3's architectural changes likely enhanced layer-wise context retention, particularly for Q-Anchored methods
3. **Dataset Sensitivity**: HotpotQA (multi-hop QA) shows the most pronounced layer-dependent performance variations, indicating challenges with complex reasoning tasks
4. **Confidence Intervals**: The shaded regions reveal that v0.3 methods have tighter confidence bounds, suggesting more robust training
Notable anomalies include the NQ method's extreme volatility (e.g., v0.1 A-Anchored NQ drops from 25→10→20) and the TriviaQA method's recovery pattern, which may indicate dataset-specific optimization opportunities.