## Diagram: Grid Transformation
### Overview
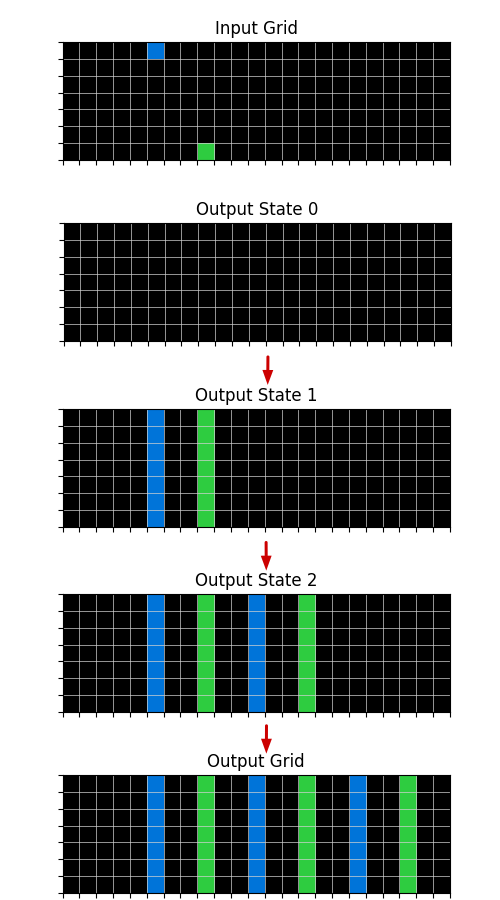
The image depicts a transformation process on a grid, showing an input grid and a series of output states leading to a final output grid. The transformation involves the propagation or modification of colored cells (blue and green) across the grid through several intermediate states.
### Components/Axes
* **Titles:**
* Input Grid
* Output State 0
* Output State 1
* Output State 2
* Output Grid
* **Grids:** Each state (Input Grid, Output State 0, Output State 1, Output State 2, Output Grid) is represented as a grid. Each grid appears to be 16x8 (16 columns and 8 rows).
* **Arrows:** Red arrows indicate the flow of transformation from one state to the next.
### Detailed Analysis
* **Input Grid:**
* A single blue cell is present in the top row, approximately in the 4th column.
* A single green cell is present in the 2nd row, approximately in the 2nd column.
* **Output State 0:**
* The grid is entirely black, indicating an initial state with no active cells.
* **Output State 1:**
* A blue vertical bar (one cell wide, 8 cells tall) appears in approximately the 4th column.
* A green vertical bar (one cell wide, 8 cells tall) appears in approximately the 6th column.
* **Output State 2:**
* A blue vertical bar appears in approximately the 2nd column.
* A green vertical bar appears in approximately the 4th column.
* A blue vertical bar appears in approximately the 6th column.
* A green vertical bar appears in approximately the 8th column.
* **Output Grid:**
* A green vertical bar appears in approximately the 2nd column.
* A blue vertical bar appears in approximately the 4th column.
* A green vertical bar appears in approximately the 6th column.
* A blue vertical bar appears in approximately the 8th column.
* A green vertical bar appears in approximately the 10th column.
### Key Observations
* The initial blue and green cells in the Input Grid seem to trigger the formation of vertical bars in subsequent states.
* The transformation process involves the propagation and alternation of blue and green bars across the grid.
* The number of bars increases with each state until the final Output Grid is reached.
### Interpretation
The diagram illustrates a cellular automaton or a similar grid-based transformation process. The initial configuration of cells in the Input Grid determines the evolution of the grid through several states, resulting in a final pattern in the Output Grid. The process appears to involve a rule-based system where the presence of a cell in one state influences the state of neighboring cells in the next state. The alternation of blue and green bars suggests a specific rule set governing the transformation.