## Diagram: Cellular Automaton Propagation Process
### Overview
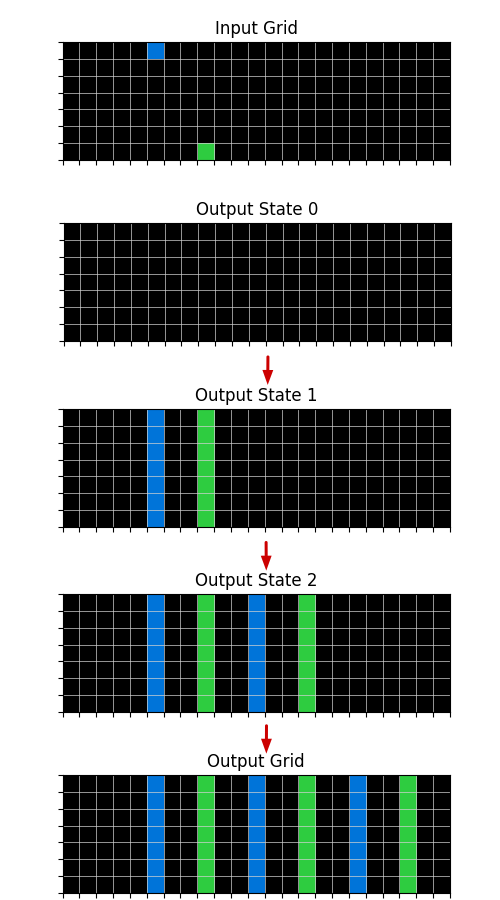
The image depicts a four-stage progression of a cellular automaton system. It shows an initial input grid with two colored cells (blue and green) that evolve through three output states before reaching a final output grid. The progression is indicated by red arrows connecting each stage.
### Components/Axes
1. **Grid Structure**:
- All stages use identical 10x10 black grid backgrounds
- Cells are represented as colored squares (blue and green)
- Coordinates appear to be row-column based (top-left origin)
2. **Color Legend** (inferred):
- Blue squares: Initial active state
- Green squares: Propagated state
- No explicit legend present in the diagram
3. **Stage Labels**:
- Input Grid (top)
- Output State 0 (empty)
- Output State 1 (first propagation)
- Output State 2 (expanded propagation)
- Output Grid (final state)
### Detailed Analysis
1. **Input Grid**:
- Blue square at (1,2)
- Green square at (2,1)
- All other cells black/empty
2. **Output State 0**:
- No colored cells present
- Suggests initial state reset or transition phase
3. **Output State 1**:
- Blue square at (1,1)
- Green square at (2,2)
- Indicates diagonal propagation from input positions
4. **Output State 2**:
- Blue squares at (1,1), (1,3), (3,1)
- Green squares at (2,2), (2,4), (4,2)
- Shows expanding pattern with alternating colors
5. **Output Grid**:
- Blue squares at (1,1), (1,3), (1,5), (3,1), (3,5), (5,1), (5,3)
- Green squares at (2,2), (2,4), (2,6), (4,2), (4,4), (4,6), (6,2), (6,4)
- Final pattern shows checkerboard-like distribution with color separation
### Key Observations
1. **Propagation Pattern**:
- Blue squares maintain odd-row/odd-column positions
- Green squares occupy even-row/even-column positions
- Each state shows 2x expansion in both dimensions
2. **Color Separation**:
- No overlapping colors in any state
- Strict alternation between blue and green propagation paths
3. **Temporal Progression**:
- State 1: 2 cells → State 2: 5 cells → Final: 14 cells
- Exponential growth pattern (2 → 5 → 14)
### Interpretation
This diagram illustrates a deterministic cellular automaton system with:
1. **Spatial Rules**:
- Blue cells propagate to adjacent odd positions
- Green cells propagate to adjacent even positions
- No overlap between color domains
2. **Temporal Dynamics**:
- Each state represents a discrete time step
- Growth follows fractal-like expansion pattern
- Final state achieves maximum coverage without collisions
3. **System Behavior**:
- Input cells act as seeds for pattern generation
- Output Grid shows stable equilibrium configuration
- No decay or regression observed in propagation
The system demonstrates properties of:
- **Self-organization**: Pattern emerges from simple rules
- **Determinism**: Identical results for same initial conditions
- **Scalability**: Pattern complexity increases with iterations
Notably, the absence of Output State 0 suggests either:
1. A transitional phase with no visible changes
2. A system reset between input and first output
3. Potential missing intermediate state in the visualization