## Line Graph: Model Accuracy Across Categories
### Overview
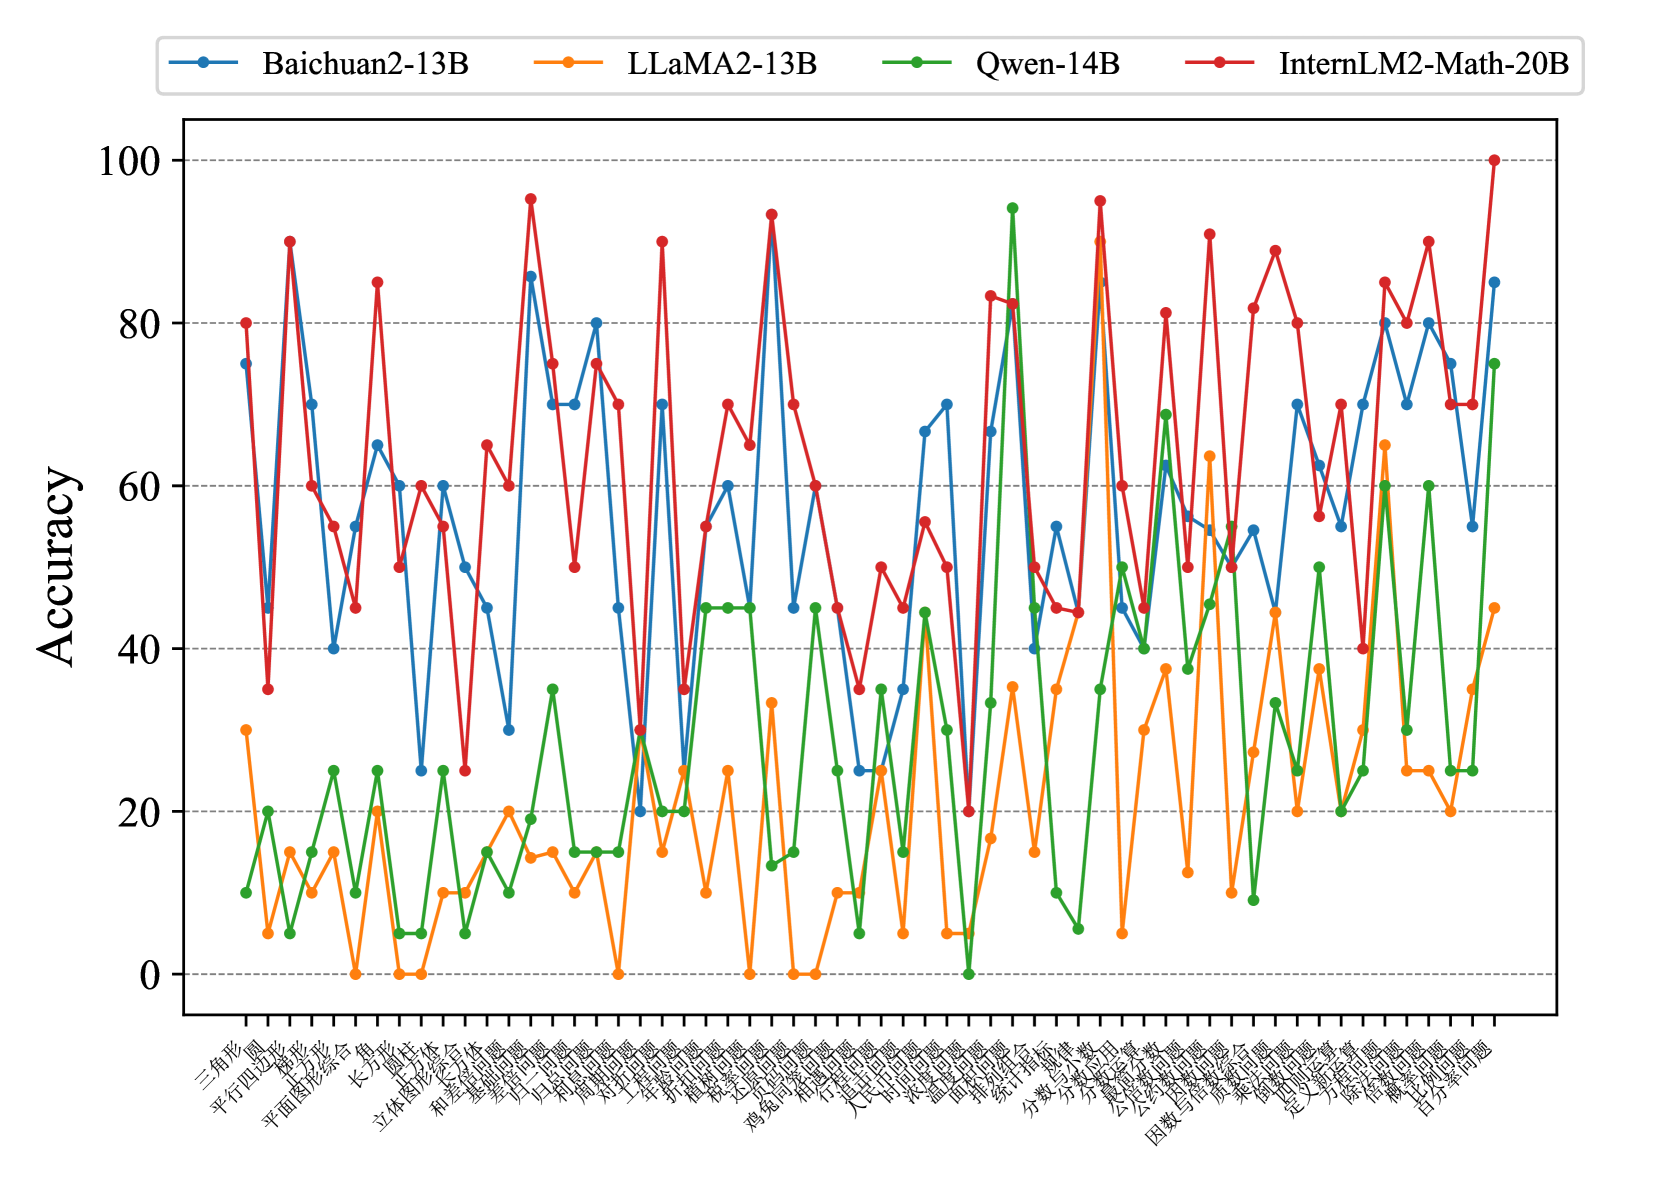
The image is a line graph comparing the accuracy of four AI models (Baichuan2-13B, LLaMA2-13B, Qwen-14B, InternLM2-Math-20B) across multiple categories. The x-axis contains Chinese text labels (likely categories or topics), and the y-axis represents accuracy as a percentage from 0 to 100. The graph shows significant fluctuations in accuracy for all models, with sharp peaks and troughs.
### Components/Axes
- **X-axis**: Chinese text labels (e.g., "三角形", "四边形", "圆形", etc.), representing categories or topics. The exact meaning of these labels is not translated here, as they are in Chinese.
- **Y-axis**: Labeled "Accuracy" with a scale from 0 to 100.
- **Legend**: Located in the top-left corner, with four colored lines:
- **Blue**: Baichuan2-13B
- **Orange**: LLaMA2-13B
- **Green**: Qwen-14B
- **Red**: InternLM2-Math-20B
### Detailed Analysis
- **Baichuan2-13B (Blue)**:
- Peaks at ~80-90% accuracy in some categories (e.g., "长方体", "立体图形").
- Drops to ~20-30% in others (e.g., "平面图形", "几何图形").
- Average accuracy ~50-60%.
- **LLaMA2-13B (Orange)**:
- Consistently the lowest performer, with accuracy often near 0% (e.g., "平面图形", "几何图形").
- Peaks at ~40-50% in a few categories (e.g., "立体图形", "几何图形").
- Average accuracy ~20-30%.
- **Qwen-14B (Green)**:
- Peaks at ~70-80% in some categories (e.g., "立体图形", "几何图形").
- Drops to ~10-20% in others (e.g., "平面图形", "几何图形").
- Average accuracy ~40-50%.
- **InternLM2-Math-20B (Red)**:
- Highest overall performance, with peaks at ~100% in some categories (e.g., "立体图形", "几何图形").
- Drops to ~40-50% in others (e.g., "平面图形", "几何图形").
- Average accuracy ~60-70%.
### Key Observations
1. **InternLM2-Math-20B (Red)** consistently outperforms other models, achieving the highest accuracy in most categories.
2. **LLaMA2-13B (Orange)** shows the most erratic performance, with frequent drops to near-zero accuracy.
3. **Baichuan2-13B (Blue)** and **Qwen-14B (Green)** exhibit moderate performance, with significant variability depending on the category.
4. **Accuracy fluctuations** suggest that model performance is highly dependent on the specific category or task being evaluated.
### Interpretation
The data indicates that **InternLM2-Math-20B** is the most robust model across the tested categories, likely due to specialized training in mathematical or geometric tasks. **LLaMA2-13B**'s poor performance in many categories suggests limitations in handling certain types of problems. The variability in accuracy across models highlights the importance of model selection based on the specific application or domain. The Chinese category labels (e.g., "三角形", "四边形") likely represent geometric shapes or mathematical concepts, but their exact meaning requires translation for deeper analysis.