## Diagram: Reductions between Cryptosystem, Average-Case, and Worst-Case Scenarios
### Overview
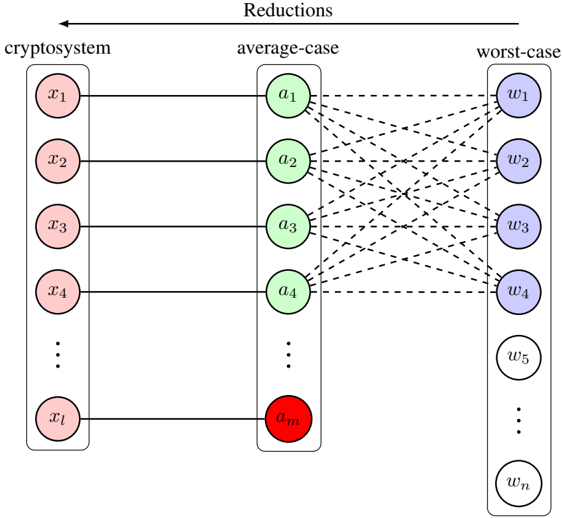
The image is a diagram illustrating reductions between a cryptosystem, average-case scenarios, and worst-case scenarios. It uses nodes (circles) to represent instances within each category and lines to represent reductions between them. The diagram shows how problems in the cryptosystem can be reduced to average-case problems, and how average-case problems can be further reduced to worst-case problems.
### Components/Axes
* **Title:** Reductions (indicated by an arrow pointing from left to right above the three categories)
* **Categories (from left to right):**
* cryptosystem
* average-case
* worst-case
* **Nodes:**
* cryptosystem: x1, x2, x3, x4, ..., xl (colored red)
* average-case: a1, a2, a3, a4, ..., am (colored green, except am which is red)
* worst-case: w1, w2, w3, w4, w5, ..., wn (colored blue)
* **Connections:**
* Solid lines connect each 'x' node in the cryptosystem to a corresponding 'a' node in the average-case.
* Dashed lines connect each 'a' node in the average-case to multiple 'w' nodes in the worst-case.
### Detailed Analysis
* **Cryptosystem Nodes:**
* x1 is connected to a1.
* x2 is connected to a2.
* x3 is connected to a3.
* x4 is connected to a4.
* xl is connected to am.
* **Average-Case Nodes:**
* a1 is connected to w1, w2, w3, w4.
* a2 is connected to w1, w2, w3, w4.
* a3 is connected to w1, w2, w3, w4.
* a4 is connected to w1, w2, w3, w4.
* am is connected to w1, w2, w3, w4.
* **Color Coding:**
* Cryptosystem nodes (x1 to xl) are colored red.
* Average-case nodes (a1 to a4) are colored green, except for am, which is red.
* Worst-case nodes (w1 to wn) are colored blue.
* **Connections:**
* Connections between the cryptosystem and average-case are one-to-one (each x connects to one a).
* Connections between the average-case and worst-case are one-to-many (each a connects to multiple w's).
### Key Observations
* The diagram illustrates a reduction process, moving from the cryptosystem to average-case and then to worst-case scenarios.
* The connections between average-case and worst-case are complex, with each average-case instance potentially reducing to multiple worst-case instances.
* The node 'am' in the average-case is colored red, similar to the cryptosystem nodes, which might indicate a special property or relationship.
### Interpretation
The diagram visually represents the concept of reductions in complexity theory, specifically in the context of cryptography. It suggests that solving problems in a cryptosystem can be reduced to solving average-case problems, which in turn can be reduced to solving worst-case problems. The one-to-many connections between average-case and worst-case scenarios highlight the potential for a single average-case problem to be related to multiple worst-case problems. The red color of 'am' might indicate that this specific average-case instance is particularly difficult or closely related to the original cryptosystem problem. The diagram implies that if the worst-case problems are hard to solve, then the average-case and cryptosystem problems are also likely to be hard.