\n
## Diagram: Cryptosystem Reductions
### Overview
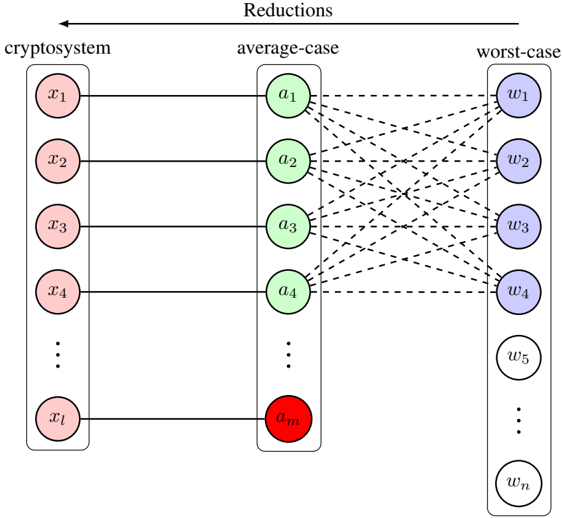
The image is a diagram illustrating reductions between a cryptosystem, an average-case scenario, and a worst-case scenario. It depicts a mapping of inputs from the cryptosystem to intermediate values in the average-case, and then to outputs in the worst-case. The diagram uses circles to represent variables or values, and dashed lines to indicate relationships or transformations.
### Components/Axes
The diagram is divided into three main columns, labeled from left to right: "cryptosystem", "average-case", and "worst-case".
* **Cryptosystem:** Contains variables labeled `x1`, `x2`, `x3`, `x4`, and continuing down to `xl`.
* **Average-case:** Contains variables labeled `a1`, `a2`, `a3`, `a4`, and continuing down to `am`. The `am` variable is highlighted in red.
* **Worst-case:** Contains variables labeled `w1`, `w2`, `w3`, `w4`, `w5`, and continuing down to `wn`.
* The entire diagram is titled "Reductions" at the top.
* Dashed lines connect the cryptosystem variables to the average-case variables, and the average-case variables to the worst-case variables.
### Detailed Analysis or Content Details
The diagram shows a many-to-many mapping. Each `x` variable in the cryptosystem is connected to *every* `a` variable in the average-case. Similarly, each `a` variable in the average-case is connected to *every* `w` variable in the worst-case.
* The cryptosystem has `l` input variables (`x1` to `xl`).
* The average-case has `m` intermediate variables (`a1` to `am`).
* The worst-case has `n` output variables (`w1` to `wn`).
* The variable `am` is visually distinguished by being colored red. This suggests it may be a critical or special case.
### Key Observations
The diagram illustrates a reduction process where solving the cryptosystem is reduced to solving the average-case, and solving the average-case is reduced to solving the worst-case. The complete connectivity between the columns suggests that the complexity of the cryptosystem is related to the complexity of both the average-case and worst-case scenarios. The red highlighting of `am` suggests it may be a bottleneck or a key element in the reduction.
### Interpretation
This diagram likely represents a security proof in cryptography. The "reductions" title indicates that the security of the cryptosystem is being shown to depend on the hardness of a problem in the average-case, which in turn is related to the hardness of a problem in the worst-case.
The complete connections between the columns suggest that if an attacker can efficiently solve the worst-case problem, they can also efficiently solve the average-case problem, and consequently break the cryptosystem. The red `am` variable could represent a specific instance or condition that is crucial for the reduction to hold. For example, it might be a specific input that reveals information about the cryptosystem's key.
The diagram is a high-level conceptual illustration and does not contain specific numerical data. It is a visual representation of a mathematical argument about the security of a cryptosystem. The diagram is a visual aid to understand the relationships between different computational problems and their implications for cryptographic security.