## Diagram: Cryptosystem Reduction Flowchart
### Overview
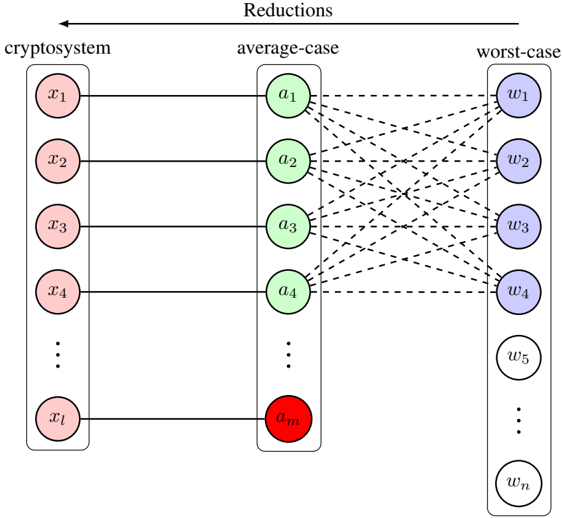
The diagram illustrates a cryptosystem's reduction process across three conceptual layers: **cryptosystem**, **average-case**, and **worst-case**. It uses nodes (labeled `x1` to `xm`, `a1` to `am`, `w1` to `wn`) connected by bidirectional dashed arrows to represent relationships between components. The structure suggests a layered analysis of cryptographic elements, with the cryptosystem layer feeding into average-case and worst-case scenarios.
### Components/Axes
- **Nodes**:
- **Cryptosystem Layer**: `x1`, `x2`, `x3`, `x4`, ..., `xm` (pink ellipses).
- **Average-Case Layer**: `a1`, `a2`, `a3`, `a4`, ..., `am` (green ellipses).
- **Worst-Case Layer**: `w1`, `w2`, `w3`, `w4`, ..., `wn` (purple ellipses).
- **Arrows**:
- Bidirectional dashed arrows connect:
- Each `xi` (cryptosystem) to all `aj` (average-case).
- Each `aj` (average-case) to all `wk` (worst-case).
- **Legend**: No explicit legend is present, but colors (pink, green, purple) visually distinguish layers.
### Detailed Analysis
1. **Cryptosystem Layer**:
- Contains `m` nodes (`x1` to `xm`), representing foundational cryptographic elements (e.g., keys, algorithms).
2. **Average-Case Layer**:
- Contains `m` nodes (`a1` to `am`), likely representing probabilistic or expected-case scenarios derived from the cryptosystem.
3. **Worst-Case Layer**:
- Contains `n` nodes (`w1` to `wn`), representing adversarial or failure scenarios.
4. **Connections**:
- Every `xi` is linked to all `aj`, implying a many-to-many relationship between cryptosystem components and average-case scenarios.
- Every `aj` is linked to all `wk`, suggesting average-case scenarios propagate to worst-case outcomes.
### Key Observations
- **Layered Dependency**: The cryptosystem layer is the source of all reductions, with no direct connections between average-case and worst-case layers.
- **Bidirectional Arrows**: Suggest mutual influence or equivalence between layers (e.g., worst-case scenarios might inform cryptosystem design).
- **Scalability**: The use of ellipses with `...` indicates the diagram represents a generalized, scalable system beyond the labeled nodes.
### Interpretation
The diagram models a cryptographic system where components (`xi`) are analyzed under two risk frameworks:
1. **Average-Case Analysis**: Assesses typical security under normal conditions (`aj`).
2. **Worst-Case Analysis**: Evaluates vulnerabilities under extreme adversarial conditions (`wk`).
The bidirectional arrows imply that worst-case scenarios (`wk`) could retroactively influence average-case assumptions (`aj`), and vice versa. This structure aligns with cryptographic security proofs, where reductions from worst-case to average-case hardness are common (e.g., lattice-based cryptography). The absence of a legend suggests colors are purely visual aids, not data-driven.
**Notable Pattern**: The equal number of nodes in cryptosystem and average-case layers (`m`) implies a 1:1 mapping, while the worst-case layer (`n`) may have more nodes, reflecting increased complexity in adversarial scenarios.