# Technical Document Extraction: Accuracy vs. Model Generation Budget
## 1. Image Overview
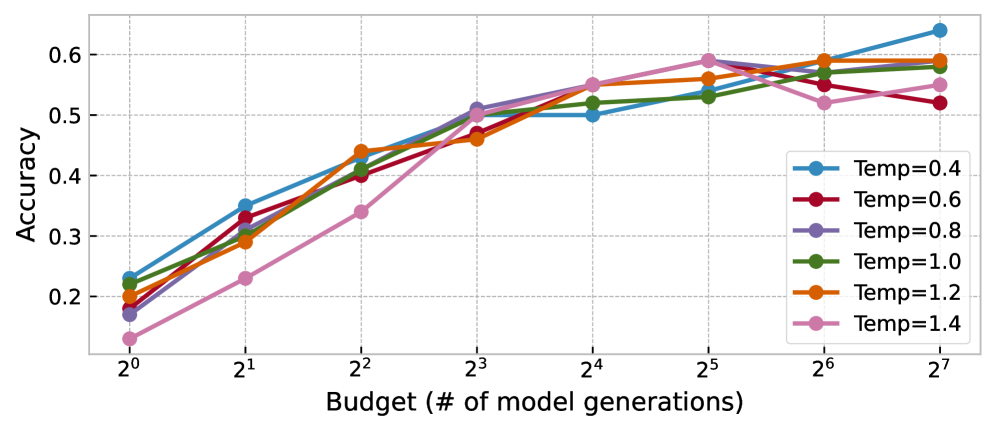
This image is a line graph illustrating the relationship between the computational budget (defined as the number of model generations) and the resulting accuracy of a system. The data is categorized by different "Temperature" (Temp) settings, ranging from 0.4 to 1.4.
## 2. Component Isolation
### A. Header/Axes
* **Y-Axis Label:** Accuracy
* **Y-Axis Scale:** Linear, ranging from 0.1 to 0.6 (with major ticks at 0.2, 0.3, 0.4, 0.5, 0.6).
* **X-Axis Label:** Budget (# of model generations)
* **X-Axis Scale:** Logarithmic (base 2), ranging from $2^0$ (1) to $2^7$ (128). Specific markers: $2^0, 2^1, 2^2, 2^3, 2^4, 2^5, 2^6, 2^7$.
### B. Legend (Spatial Grounding: Bottom Right [x≈0.8, y≈0.3])
The legend identifies six distinct data series based on color and marker:
* **Blue (●):** Temp=0.4
* **Dark Red (●):** Temp=0.6
* **Purple (●):** Temp=0.8
* **Green (●):** Temp=1.0
* **Orange (●):** Temp=1.2
* **Pink (●):** Temp=1.4
## 3. Trend Verification and Data Extraction
All series exhibit a general upward trend: as the budget (number of generations) increases, accuracy improves. However, the rate of improvement and the final saturation point vary by temperature.
### Data Table (Estimated Values)
| Budget ($2^n$) | Temp=0.4 (Blue) | Temp=0.6 (Red) | Temp=0.8 (Purple) | Temp=1.0 (Green) | Temp=1.2 (Orange) | Temp=1.4 (Pink) |
| :--- | :--- | :--- | :--- | :--- | :--- | :--- |
| **$2^0$ (1)** | 0.23 | 0.18 | 0.17 | 0.22 | 0.20 | 0.13 |
| **$2^1$ (2)** | 0.35 | 0.33 | 0.30 | 0.31 | 0.29 | 0.23 |
| **$2^2$ (4)** | 0.43 | 0.40 | 0.41 | 0.41 | 0.44 | 0.34 |
| **$2^3$ (8)** | 0.51 | 0.47 | 0.51 | 0.46 | 0.46 | 0.50 |
| **$2^4$ (16)** | 0.50 | 0.55 | 0.55 | 0.52 | 0.55 | 0.55 |
| **$2^5$ (32)** | 0.54 | 0.59 | 0.59 | 0.53 | 0.56 | 0.59 |
| **$2^6$ (64)** | 0.58 | 0.55 | 0.56 | 0.57 | 0.59 | 0.52 |
| **$2^7$ (128)** | 0.64 | 0.52 | 0.58 | 0.58 | 0.59 | 0.55 |
## 4. Key Observations and Analysis
* **Low Budget Performance ($2^0$ to $2^2$):** Lower temperatures (specifically Temp=0.4) generally start with higher accuracy. Temp=1.4 (Pink) is the clear underperformer at low budgets, starting significantly lower than the others.
* **Mid-Range Convergence ($2^3$ to $2^5$):** Between 8 and 32 generations, the performance of all temperature settings converges significantly, with most values falling between 0.45 and 0.60.
* **High Budget Performance ($2^6$ to $2^7$):**
* **Temp=0.4 (Blue)** shows the most consistent late-stage growth, achieving the highest overall accuracy of approximately 0.64 at the $2^7$ budget.
* **Temp=0.6 (Red)** and **Temp=1.4 (Pink)** exhibit "peaking" behavior, where accuracy actually declines or plateaus after $2^5$.
* **Temp=1.2 (Orange)** and **Temp=1.0 (Green)** show stable, high performance at the maximum budget, plateauing around 0.58-0.59.
* **Optimal Temperature:** While lower temperatures perform better at the extremes (very low and very high budgets), a mid-range temperature like 0.8 or 1.2 provides more consistent, competitive results across the middle of the budget spectrum.