# Technical Document Extraction: Line Chart Analysis
## 1. Chart Type and Overview
- **Chart Type**: Line chart
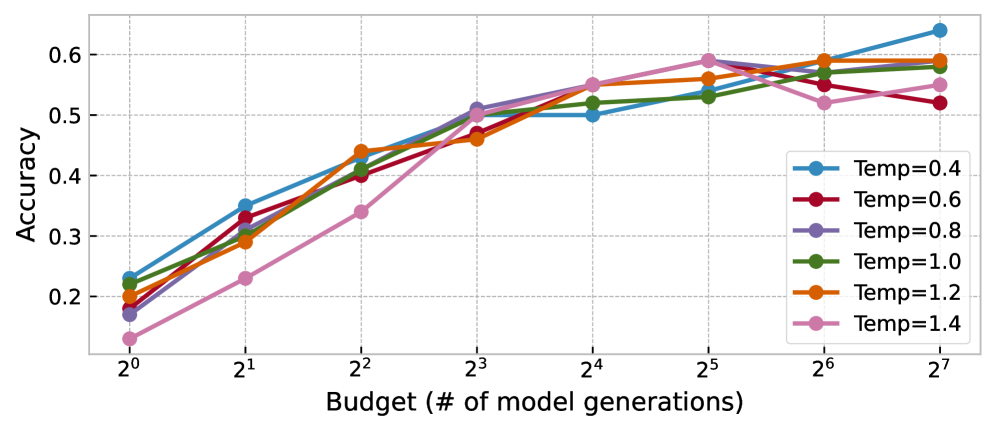
- **Purpose**: Visualizes model accuracy trends across varying computational budgets (model generations) for different temperature settings.
## 2. Axis Labels and Markers
- **X-Axis (Horizontal)**:
- **Title**: "Budget (# of model generations)"
- **Scale**: Logarithmic (powers of 2)
- **Ticks**: 2⁰, 2¹, 2², 2³, 2⁴, 2⁵, 2⁶, 2⁷
- **Range**: 1 to 128 model generations
- **Y-Axis (Vertical)**:
- **Title**: "Accuracy"
- **Scale**: Linear (0.2 to 0.6)
- **Ticks**: 0.2, 0.3, 0.4, 0.5, 0.6
## 3. Legend and Color Mapping
- **Legend Placement**: Upper-right corner
- **Color-Temperature Mapping**:
- **Blue**: Temp=0.4
- **Red**: Temp=0.6
- **Purple**: Temp=0.8
- **Green**: Temp=1.0
- **Orange**: Temp=1.2
- **Pink**: Temp=1.4
- **Validation**: All line colors in the chart match the legend entries exactly.
## 4. Key Trends and Data Points
### Line Series Analysis
1. **Temp=0.4 (Blue)**:
- **Trend**: Steady upward slope from ~0.22 (2⁰) to ~0.64 (2⁷).
- **Notable**: Highest final accuracy among all series.
2. **Temp=0.6 (Red)**:
- **Trend**: Gradual increase from ~0.18 (2⁰) to ~0.52 (2⁷).
- **Notable**: Slower growth compared to lower temperatures.
3. **Temp=0.8 (Purple)**:
- **Trend**: Sharp rise from ~0.16 (2⁰) to ~0.58 (2⁵), then plateaus.
- **Notable**: Early rapid improvement but stabilizes at mid-budget.
4. **Temp=1.0 (Green)**:
- **Trend**: Moderate growth from ~0.21 (2⁰) to ~0.56 (2⁷).
- **Notable**: Consistent performance across all budgets.
5. **Temp=1.2 (Orange)**:
- **Trend**: Steady climb from ~0.20 (2⁰) to ~0.59 (2⁷).
- **Notable**: Balanced growth with minimal plateauing.
6. **Temp=1.4 (Pink)**:
- **Trend**: Rapid ascent from ~0.14 (2⁰) to ~0.59 (2⁵), followed by a slight dip.
- **Notable**: Peaks early but underperforms at highest budgets.
## 5. Spatial Grounding
- **Legend Position**: Top-right quadrant (coordinates: [x=0.8, y=0.9] relative to chart bounds).
- **Line Placement**: All lines originate from the bottom-left (2⁰) and extend toward the top-right, with varying slopes.
## 6. Component Isolation
- **Regions**:
1. **Header**: No explicit title present.
2. **Main Chart**: Axes, gridlines, and six data series.
3. **Footer**: No additional annotations.
## 7. Data Validation
- **Color Consistency**: All legend colors match their corresponding lines in the chart.
- **Trend Logic**: Higher temperatures (e.g., 1.4) show faster initial growth but may plateau or decline at larger budgets, while lower temperatures (e.g., 0.4) exhibit steadier, sustained improvement.
## 8. Missing Elements
- **Data Table**: No explicit table present; data inferred from line positions.
- **Additional Text**: No embedded text beyond axis labels and legend.
## 9. Summary
The chart demonstrates that lower temperature settings (e.g., 0.4) achieve higher final accuracy with increasing computational budgets, while higher temperatures (e.g., 1.4) show rapid early gains but diminished returns at larger scales. All trends align with the logarithmic budget scale, emphasizing efficiency trade-offs across temperature configurations.