# Technical Document Extraction: Flow Length Frequency Distribution
## 1. Document Overview
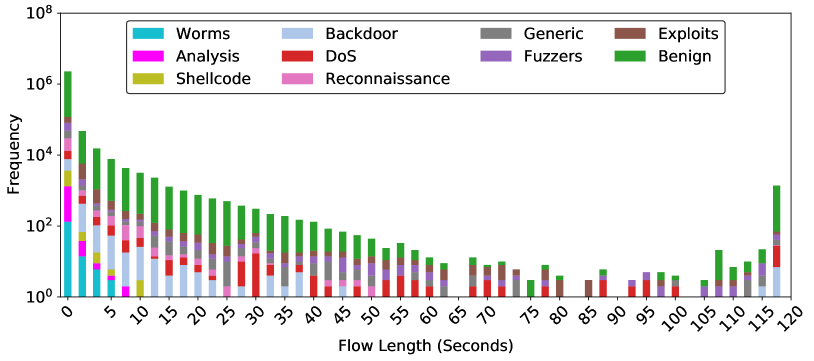
This image is a stacked bar chart illustrating the frequency distribution of network traffic "Flow Length" measured in seconds. The data is categorized by traffic type, distinguishing between benign traffic and various classes of cyberattacks.
## 2. Component Isolation
### A. Header / Legend
The legend is located at the top center of the chart area, enclosed in a black border. It contains 10 categories with corresponding color codes:
| Color | Label | Category Type |
| :--- | :--- | :--- |
| **Cyan** | Worms | Attack |
| **Magenta** | Analysis | Attack |
| **Olive/Gold** | Shellcode | Attack |
| **Light Blue** | Backdoor | Attack |
| **Red** | DoS (Denial of Service) | Attack |
| **Pink** | Reconnaissance | Attack |
| **Grey** | Generic | Attack |
| **Purple** | Fuzzers | Attack |
| **Brown** | Exploits | Attack |
| **Green** | Benign | Normal Traffic |
### B. Main Chart Area (Axes)
* **Y-Axis (Vertical):** Labeled "**Frequency**". It uses a **logarithmic scale** ranging from $10^0$ (1) to $10^8$ (100,000,000). Major tick marks are provided for $10^0, 10^2, 10^4, 10^6,$ and $10^8$.
* **X-Axis (Horizontal):** Labeled "**Flow Length (Seconds)**". It uses a linear scale ranging from 0 to 120 seconds. Tick marks and labels are provided at intervals of 5 seconds (0, 5, 10, ... 120).
## 3. Data Trends and Observations
### General Trend
The chart shows a heavy-tailed distribution. The vast majority of network flows (both benign and malicious) have a very short duration (0-5 seconds). As the flow length increases, the frequency generally decays exponentially until approximately 65 seconds, after which the data becomes sparse and fluctuates at low frequencies, with a notable spike at the 120-second mark.
### Category-Specific Trends
1. **Benign (Green):** This category dominates the frequency across almost all time intervals, particularly in the 0-5 second range where it reaches its peak near $10^8$.
2. **Exploits (Brown) & Fuzzers (Purple):** These are the most frequent attack types, consistently appearing across the 0-60 second range.
3. **Generic (Grey):** Shows significant presence in the very short duration flows (0-2 seconds).
4. **Long Duration Flows:** At the 120-second mark, there is a visible accumulation of various traffic types, suggesting a timeout or a maximum recording threshold for flow duration.