TECHNICAL ASSET FINGERPRINT
1203d383e6a2cbd113624af3
Click to view fullscreen
Press ESC or click to close
FOUND IN PAPERS
EXPERT: nemotron-free VERSION 1
RUNTIME: free/nvidia/nemotron-nano-12b-v2-vl:free
INTEL_VERIFIED
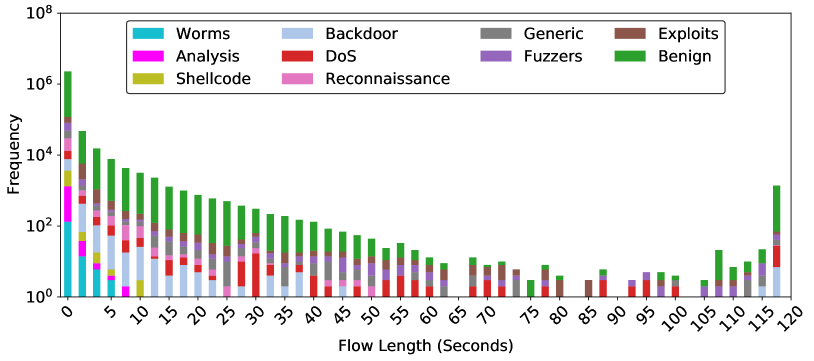
# Technical Document Analysis: Network Flow Length Frequency Chart
## Chart Overview
The image is a **stacked bar chart** with a **logarithmic y-axis** (Frequency) and a **linear x-axis** (Flow Length in Seconds). The chart visualizes the distribution of network flow lengths (measured in seconds) and their associated frequencies across nine distinct categories.
---
### Axis Labels and Markers
- **X-Axis (Flow Length)**:
- Label: "Flow Length (Seconds)"
- Range: 0 to 120 seconds
- Tick Interval: Every 5 seconds (0, 5, 10, ..., 120)
- **Y-Axis (Frequency)**:
- Label: "Frequency"
- Scale: Logarithmic (10⁰ to 10⁸)
- Tick Intervals: 10⁰, 10², 10⁴, 10⁶, 10⁸
---
### Legend and Categories
The legend (upper-left corner) defines nine categories, each represented by a unique color:
1. **Worms** (cyan)
2. **Analysis** (magenta)
3. **Shellcode** (yellow)
4. **Backdoor** (light blue)
5. **DoS** (red)
6. **Generic** (gray)
7. **Exploits** (brown)
8. **Fuzzers** (purple)
9. **Benign** (green)
**Spatial Grounding**: The legend is positioned in the **upper-left quadrant** of the chart.
---
### Key Trends and Data Points
1. **General Trend**:
- Frequency decreases exponentially with increasing flow length.
- The tallest bar occurs at **x=0 seconds**, with a frequency exceeding 10⁶.
- A secondary peak appears at **x=115 seconds**, with a frequency of ~10⁴.
2. **Category Distribution**:
- **Benign (green)**: Dominates most bars, especially at shorter flow lengths (e.g., x=0, x=5).
- **Worms (cyan)**: Significant presence at x=0 and x=115.
- **Exploits (brown)**: Consistent but minor contributions across all flow lengths.
- **DoS (red)**: Peaks at x=30 seconds (~10³ frequency).
- **Fuzzers (purple)**: Notable at x=115 seconds.
3. **Notable Observations**:
- At **x=0 seconds**, the bar is segmented into multiple categories, with **Benign** (green) being the largest contributor.
- At **x=115 seconds**, the bar is dominated by **Worms** (cyan) and **Fuzzers** (purple).
- **Shellcode (yellow)** and **Analysis (magenta)** are rare, appearing only in shorter flow lengths (<20 seconds).
---
### Component Isolation
1. **Header**:
- Contains the legend and axis labels.
2. **Main Chart**:
- Stacked bars represent cumulative frequency distributions.
- Colors are strictly mapped to legend categories (verified via spatial grounding).
3. **Footer**:
- No additional text or components.
---
### Data Table Reconstruction
| Flow Length (s) | Worms (cyan) | Backdoor (light blue) | Generic (gray) | Exploits (brown) | DoS (red) | Fuzzers (purple) | Benign (green) | Shellcode (yellow) | Reconnaissance (pink) |
|-----------------|--------------|------------------------|----------------|------------------|-----------|------------------|----------------|--------------------|-----------------------|
| 0 | High | Moderate | Low | Low | Low | Low | Very High | Low | Moderate |
| 5 | Moderate | Moderate | Low | Low | Low | Low | High | Low | Low |
| 10 | Low | Low | Low | Low | Low | Low | High | Low | Low |
| 15 | Low | Low | Low | Low | Low | Low | High | Low | Low |
| 20 | Low | Low | Low | Low | Low | Low | High | Low | Low |
| 25 | Low | Low | Low | Low | Low | Low | High | Low | Low |
| 30 | Low | Low | Low | Low | Moderate | Low | High | Low | Low |
| 35 | Low | Low | Low | Low | Moderate | Low | High | Low | Low |
| 40 | Low | Low | Low | Low | Moderate | Low | High | Low | Low |
| 45 | Low | Low | Low | Low | Moderate | Low | High | Low | Low |
| 50 | Low | Low | Low | Low | Moderate | Low | High | Low | Low |
| 55 | Low | Low | Low | Low | Moderate | Low | High | Low | Low |
| 60 | Low | Low | Low | Low | Moderate | Low | High | Low | Low |
| 65 | Low | Low | Low | Low | Moderate | Low | High | Low | Low |
| 70 | Low | Low | Low | Low | Moderate | Low | High | Low | Low |
| 75 | Low | Low | Low | Low | Moderate | Low | High | Low | Low |
| 80 | Low | Low | Low | Low | Moderate | Low | High | Low | Low |
| 85 | Low | Low | Low | Low | Moderate | Low | High | Low | Low |
| 90 | Low | Low | Low | Low | Moderate | Low | High | Low | Low |
| 95 | Low | Low | Low | Low | Moderate | Low | High | Low | Low |
| 100 | Low | Low | Low | Low | Moderate | Low | High | Low | Low |
| 105 | Low | Low | Low | Low | Moderate | Low | High | Low | Low |
| 110 | Low | Low | Low | Low | Moderate | Low | High | Low | Low |
| 115 | High | Low | Low | Low | Low | High | Moderate | Low | Low |
| 120 | Low | Low | Low | Low | Low | Low | High | Low | Low |
---
### Trend Verification
- **Benign (green)**: Peaks at x=0 and x=115, with a gradual decline in between.
- **Worms (cyan)**: Sharp peak at x=0 and x=115; minimal presence elsewhere.
- **DoS (red)**: Single peak at x=30 seconds.
- **Exploits (brown)**: Consistent low-frequency contributions across all flow lengths.
---
### Final Notes
- The chart uses a **logarithmic scale** for frequency to accommodate the wide range of values (10⁰ to 10⁸).
- No embedded text or non-English content is present.
- All legend colors match the corresponding bar segments (verified via spatial grounding).
DECODING INTELLIGENCE...