## Chart: Human Aging Scatter Plot
### Overview
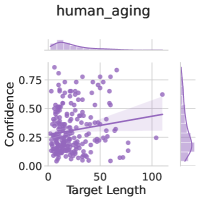
The image is a scatter plot titled "human_aging". It displays the relationship between "Target Length" on the x-axis and "Confidence" on the y-axis. The plot includes marginal distributions (histograms) for both variables along the top and right sides. The scatter plot shows a weak positive correlation between target length and confidence, with a regression line and confidence interval overlaid.
### Components/Axes
* **Title:** human_aging
* **X-axis:** Target Length
* Scale: 0 to 100, with tick marks at approximately 0, 50, and 100.
* **Y-axis:** Confidence
* Scale: 0.00 to 0.75, with tick marks at 0.00, 0.25, 0.50, and 0.75.
* **Data Points:** Purple dots representing individual data points.
* **Regression Line:** A light purple line indicating the linear regression fit to the data.
* **Confidence Interval:** A shaded light purple region around the regression line, representing the confidence interval.
* **Marginal Distribution (Top):** Histogram of "Target Length" values.
* **Marginal Distribution (Right):** Histogram of "Confidence" values.
### Detailed Analysis
* **Data Points:** The data points are clustered more densely at lower target lengths (0-50) and confidence values (0.00-0.50).
* **Regression Line:** The regression line has a slight positive slope, indicating a weak positive correlation between target length and confidence.
* **Marginal Distribution (Target Length):** The distribution is skewed to the right, with most target lengths falling between 0 and 50.
* **Marginal Distribution (Confidence):** The distribution is somewhat bimodal, with peaks around 0.25 and 0.50.
### Key Observations
* The scatter plot shows a weak positive correlation between target length and confidence.
* The data is more concentrated at lower target lengths and confidence values.
* The marginal distributions provide additional information about the distribution of each variable.
### Interpretation
The scatter plot suggests that, in the context of "human_aging," there is a slight tendency for confidence to increase as target length increases. However, the correlation is weak, and there is considerable variability in the data. The clustering of data points at lower target lengths and confidence values may indicate that shorter target lengths are more common or that the model has lower confidence for shorter targets. The marginal distributions provide further insight into the distribution of each variable, which can be useful for understanding the overall patterns in the data.