\n
## Scatter Plot with Trend Line: Human Aging Confidence vs. Target Length
### Overview
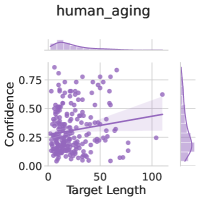
The image is a scatter plot titled "human_aging" that visualizes the relationship between "Target Length" (x-axis) and "Confidence" (y-axis). It includes a fitted trend line with a shaded confidence interval and marginal distributions (density plots) along the top and right edges. The plot uses a monochromatic purple color scheme.
### Components/Axes
* **Title:** "human_aging" (centered at the top).
* **X-Axis:**
* **Label:** "Target Length"
* **Scale:** Linear, ranging from 0 to 100.
* **Major Ticks:** 0, 50, 100.
* **Y-Axis:**
* **Label:** "Confidence"
* **Scale:** Linear, ranging from 0.00 to approximately 0.85 (based on data point placement).
* **Major Ticks:** 0.00, 0.25, 0.50, 0.75.
* **Data Series:**
* **Scatter Points:** Represented by small, semi-transparent purple circles. There is no explicit legend for the points.
* **Trend Line:** A solid, darker purple line running through the data cloud.
* **Confidence Interval:** A lighter purple shaded area surrounding the trend line.
* **Marginal Distributions:**
* **Top (above x-axis):** A density plot showing the distribution of "Target Length" values. It peaks between 0 and 50.
* **Right (beside y-axis):** A density plot showing the distribution of "Confidence" values. It peaks between 0.25 and 0.50.
### Detailed Analysis
* **Data Point Distribution:** The majority of data points are densely clustered in the lower-left quadrant of the plot, specifically where "Target Length" is between 0 and 50 and "Confidence" is between 0.00 and 0.50. The density of points decreases as both "Target Length" and "Confidence" increase.
* **Trend Line & Correlation:** The trend line exhibits a clear **positive slope**, rising from left to right. This indicates a positive correlation between the variables: as "Target Length" increases, "Confidence" tends to increase.
* **Approximate Start Point:** The line begins near (Target Length ≈ 0, Confidence ≈ 0.25).
* **Approximate End Point:** The line ends near (Target Length ≈ 100, Confidence ≈ 0.50).
* **Confidence Interval:** The shaded confidence interval around the trend line is relatively narrow at low "Target Length" values and **widens significantly** as "Target Length" increases towards 100. This indicates greater uncertainty in the trend estimate for higher target lengths.
* **Outliers:** Several data points exist with high "Confidence" values (>0.75), primarily located at lower "Target Length" values (<50). One notable outlier is near (Target Length ≈ 10, Confidence ≈ 0.85).
### Key Observations
1. **Positive Correlation:** The primary visual trend is a positive relationship between Target Length and Confidence.
2. **Heteroscedasticity:** The spread (variance) of Confidence values appears to increase with Target Length, as suggested by the widening confidence interval and the scatter of points.
3. **Data Sparsity:** There are very few data points with a "Target Length" greater than 75, which contributes to the increased uncertainty in the trend line at the high end.
4. **Marginal Insights:** The density plots confirm that most observations have a Target Length under 50 and a Confidence score between 0.25 and 0.50.
### Interpretation
The chart suggests that within the context of "human_aging," tasks or items with a longer "Target Length" are associated with higher model "Confidence." However, this relationship is not perfectly reliable, especially for longer targets, as evidenced by the wide confidence interval and sparse data in that region.
The presence of high-confidence outliers at short target lengths indicates that some short targets are predicted with very high certainty, which may represent specific, easy-to-classify cases. The overall pattern could imply that the model's confidence is somewhat calibrated to task difficulty (where longer length may correlate with more information or context, leading to higher confidence), but the increasing uncertainty suggests the model's performance or the data's nature becomes less predictable for longer targets. The investigation would benefit from more data points at the higher end of the Target Length scale to confirm the trend and reduce uncertainty.