## Scatter Plot: Human Aging Analysis
### Overview
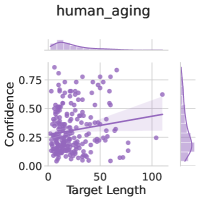
The image presents a scatter plot titled "human_aging" with a line of best fit and marginal histograms. The plot examines the relationship between "Target Length" (x-axis) and "Confidence" (y-axis), with a shaded confidence interval around the regression line. Marginal histograms show distributions of both variables.
### Components/Axes
- **X-axis (Target Length)**: Ranges from 0 to 100, labeled "Target Length."
- **Y-axis (Confidence)**: Ranges from 0.00 to 0.75, labeled "Confidence."
- **Legend**: Located in the top-right corner, identifies:
- **Blue line**: "Line of Best Fit"
- **Shaded region**: "Confidence Interval"
- **Marginal Histograms**:
- Top histogram: Distribution of "Target Length" (purple bars).
- Right histogram: Distribution of "Confidence" (purple bars).
### Detailed Analysis
- **Scatter Plot**:
- **Data Points**: ~100 purple dots distributed across the plot.
- **Line of Best Fit**: A blue line slopes upward from ~(0, 0.25) to ~(100, 0.65), indicating a positive correlation between Target Length and Confidence.
- **Confidence Interval**: A shaded blue region (≈±0.10 around the line) suggests uncertainty in the regression estimate.
- **Marginal Histograms**:
- **Target Length**: Peaks near 50–70, with a long tail toward 100.
- **Confidence**: Peaks near 0.3–0.5, with a bimodal distribution (lower peak at ~0.2 and higher peak at ~0.4).
### Key Observations
1. **Positive Correlation**: Confidence increases with Target Length, though the relationship is not perfectly linear.
2. **Data Spread**: Confidence values cluster between 0.2 and 0.6, with outliers below 0.1 and above 0.6.
3. **Confidence Interval Width**: The shaded region widens slightly at higher Target Length values, indicating increased uncertainty in predictions for larger targets.
4. **Bimodal Confidence Distribution**: Suggests two distinct subgroups in the data (e.g., low and high confidence regimes).
### Interpretation
The plot demonstrates that longer Target Lengths generally correlate with higher Confidence, but the relationship is noisy and context-dependent. The confidence interval highlights the model's uncertainty, particularly for extreme Target Length values. The bimodal Confidence distribution implies potential subgroups (e.g., age-related differences or task-specific factors) that may require further investigation. Outliers at low Confidence (e.g., Target Length < 20) could represent edge cases or data quality issues. This analysis underscores the need for domain-specific validation when interpreting aging-related metrics.