## Diagram: State Transition Diagram
### Overview
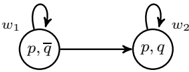
The image depicts a state transition diagram with two states, labeled w1 and w2. The diagram illustrates transitions between these states based on conditions involving variables p and q.
### Components/Axes
* **States:** Two states represented by circles.
* State 1 (left): Labeled "w1" above and to the left of the circle. The state is labeled "p, q̄" inside the circle.
* State 2 (right): Labeled "w2" above and to the right of the circle. The state is labeled "p, q" inside the circle.
* **Transitions:**
* From State 1 to State 2: A directed arrow points from the circle representing State 1 to the circle representing State 2.
* Self-loop on State 1: A curved arrow starts from the top of the circle representing State 1 and loops back to the same circle.
* Self-loop on State 2: A curved arrow starts from the top of the circle representing State 2 and loops back to the same circle.
### Detailed Analysis or ### Content Details
* **State 1 (w1):**
* Label: w1
* State Condition: p, q̄ (p and not q)
* Transition: Can transition to State 2.
* Self-loop: Can remain in State 1.
* **State 2 (w2):**
* Label: w2
* State Condition: p, q (p and q)
* Transition: Can be reached from State 1.
* Self-loop: Can remain in State 2.
* **Arrow from State 1 to State 2:** Indicates a transition from the state where p is true and q is false to the state where both p and q are true.
### Key Observations
* The diagram shows a system that can exist in two distinct states, w1 and w2.
* The system can transition from w1 to w2.
* The system can remain in either w1 or w2.
* The state w1 is associated with the condition "p, q̄", meaning p is true and q is false.
* The state w2 is associated with the condition "p, q", meaning both p and q are true.
### Interpretation
The state transition diagram represents a system whose state depends on the truth values of variables p and q. The system starts in state w1 where p is true and q is false. It can then transition to state w2 where both p and q are true. Once in either state, the system can remain in that state indefinitely. The diagram illustrates a simple model of state changes based on logical conditions.