\n
## Diagram: State Transition Diagram
### Overview
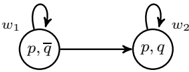
The image depicts a state transition diagram with two states connected by a single transition. Each state is represented by a circle containing variables, and the transition is labeled with weights. The diagram illustrates a process or system that can move between two distinct states.
### Components/Axes
The diagram consists of:
* **Two States:** Represented by circles.
* **Transition:** Represented by an arrow connecting the two states.
* **State 1 (Left):** Contains the variables *p*, and *q̄* (q with a bar over it).
* **State 2 (Right):** Contains the variables *p*, and *q*.
* **Transition Label 1 (Above State 1):** *w₁*
* **Transition Label 2 (Above State 2):** *w₂*
* **Arrow:** Points from State 1 to State 2.
### Detailed Analysis or Content Details
The diagram shows a transition from a state defined by variables *p* and *q̄* to a state defined by variables *p* and *q*. The transition is associated with a weight *w₁* for the loop in the first state and *w₂* for the transition between states. The variables *p* and *q* appear in both states, but *q* is negated in the first state.
### Key Observations
The diagram suggests a system where the variable *q* can change its sign during a transition. The weights *w₁* and *w₂* likely represent probabilities or costs associated with the respective transitions. The diagram does not provide numerical values for *w₁* or *w₂*, *p*, or *q*.
### Interpretation
This diagram likely represents a probabilistic or weighted state transition in a system. The change in the sign of *q* suggests a binary variable that can flip between two states. The weights *w₁* and *w₂* could represent the probabilities of remaining in the current state or transitioning to the other state, respectively. This type of diagram is commonly used in Markov chains, Bayesian networks, or other probabilistic models. The diagram is abstract and does not provide specific details about the system it represents, but it illustrates a fundamental concept of state change and associated probabilities. The diagram could represent a simple model of a binary decision process or a system with two possible states.