## Diagram: Node Transition with Weighted Arrows
### Overview
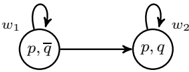
The diagram depicts a directed transition between two nodes labeled with pairs of variables (`p, q̄` and `p, q`). Arrows indicate directional relationships, with weights (`w₁`, `w₂`) assigned to loops and transitions.
### Components/Axes
- **Nodes**:
- Left node: Labeled `p, q̄` (with a bar over `q`).
- Right node: Labeled `p, q` (no bar over `q`).
- **Arrows**:
- A directed arrow from the left node to the right node, labeled `w₂`.
- A loop on the left node labeled `w₁`.
- A loop on the right node labeled `w₂`.
### Detailed Analysis
- **Left Node (`p, q̄`)**:
- Contains a self-loop labeled `w₁`, suggesting a recurrent or feedback mechanism.
- Connected via an arrow labeled `w₂` to the right node.
- **Right Node (`p, q`)**:
- Contains a self-loop labeled `w₂`, mirroring the transition weight from the left node.
- Receives input from the left node via the `w₂`-labeled arrow.
- **Spatial Relationships**:
- The left node is positioned to the left of the right node.
- Arrows and loops are placed adjacent to their respective nodes.
### Key Observations
1. The transition from `p, q̄` to `p, q` is governed by the weight `w₂`, which also governs the self-loop on the right node.
2. The self-loop `w₁` on the left node implies a potential stabilization or iterative process within that state.
3. The absence of a bar over `q` in the right node suggests a resolved or transformed state compared to the left node.
### Interpretation
This diagram likely represents a state transition system, where:
- `p, q̄` and `p, q` denote distinct states or conditions (e.g., hypotheses, data states).
- `w₁` and `w₂` are weights or probabilities influencing transitions or self-transitions.
- The loop `w₁` on the left node may indicate a damping or reinforcement mechanism, while `w₂` governs progression to the resolved state `p, q`.
- The bidirectional use of `w₂` (transition and self-loop) suggests symmetry in the system’s dynamics, possibly reflecting conservation or balance.
No numerical values or additional context are provided, limiting quantitative analysis. The diagram emphasizes structural relationships over empirical data.