## Bubble Chart: LLM Agent Benchmark Score vs. Release Time
### Overview
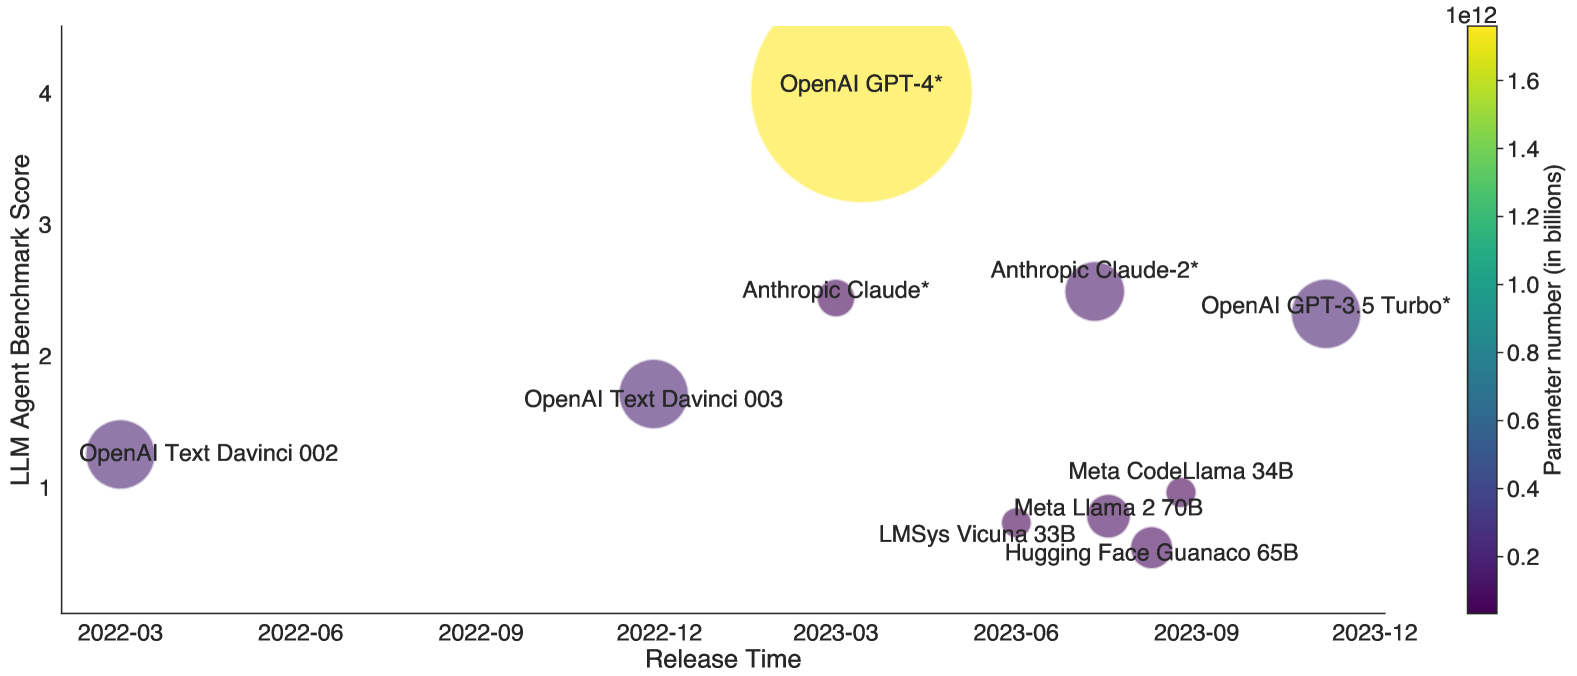
The image is a bubble chart that visualizes the relationship between the LLM Agent Benchmark Score, Release Time, and Parameter Number (in billions) for various Large Language Models (LLMs). The x-axis represents the release time, the y-axis represents the LLM Agent Benchmark Score, and the size and color of the bubbles represent the parameter number.
### Components/Axes
* **X-axis:** Release Time, with markers at 2022-03, 2022-06, 2022-09, 2022-12, 2023-03, 2023-06, 2023-09, and 2023-12.
* **Y-axis:** LLM Agent Benchmark Score, with markers at 1, 2, 3, and 4.
* **Bubble Size & Color:** Represents the Parameter Number (in billions). A color gradient from dark purple to bright yellow is used, with dark purple indicating lower parameter numbers and bright yellow indicating higher parameter numbers. The color bar on the right side shows the scale, ranging from 0.2e12 to 1.6e12.
### Detailed Analysis
Here's a breakdown of the data points, including their approximate coordinates, benchmark scores, release times, and parameter numbers:
* **OpenAI Text Davinci 002:**
* Release Time: Approximately 2022-03
* LLM Agent Benchmark Score: Approximately 1.2
* Parameter Number: Low, estimated around 0.2e12 (dark purple)
* **OpenAI Text Davinci 003:**
* Release Time: Approximately 2022-12
* LLM Agent Benchmark Score: Approximately 1.8
* Parameter Number: Low, estimated around 0.2e12 (dark purple)
* **Anthropic Claude*:**
* Release Time: Approximately 2023-03
* LLM Agent Benchmark Score: Approximately 2.5
* Parameter Number: Moderate, estimated around 0.4e12 (purple)
* **Anthropic Claude-2*:**
* Release Time: Approximately 2023-06
* LLM Agent Benchmark Score: Approximately 2.6
* Parameter Number: Moderate, estimated around 0.4e12 (purple)
* **OpenAI GPT-3.5 Turbo*:**
* Release Time: Approximately 2023-09
* LLM Agent Benchmark Score: Approximately 2.1
* Parameter Number: Moderate, estimated around 0.6e12 (purple)
* **OpenAI GPT-4*:**
* Release Time: Approximately 2023-03
* LLM Agent Benchmark Score: Approximately 3.9
* Parameter Number: Very High, estimated around 1.6e12 (yellow)
* **LMSys Vicuna 33B:**
* Release Time: Approximately 2023-06
* LLM Agent Benchmark Score: Approximately 0.7
* Parameter Number: Low, estimated around 0.2e12 (dark purple)
* **Meta Llama 2 70B:**
* Release Time: Approximately 2023-06
* LLM Agent Benchmark Score: Approximately 0.8
* Parameter Number: Low, estimated around 0.2e12 (dark purple)
* **Meta CodeLlama 34B:**
* Release Time: Approximately 2023-06
* LLM Agent Benchmark Score: Approximately 0.8
* Parameter Number: Low, estimated around 0.2e12 (dark purple)
* **Hugging Face Guanaco 65B:**
* Release Time: Approximately 2023-06
* LLM Agent Benchmark Score: Approximately 0.6
* Parameter Number: Low, estimated around 0.2e12 (dark purple)
### Key Observations
* **Trend:** There is a general trend of increasing LLM Agent Benchmark Score over time.
* **Parameter Number and Performance:** Models with higher parameter numbers (e.g., OpenAI GPT-4*) tend to have higher benchmark scores.
* **Outliers:** OpenAI GPT-4* stands out as having significantly higher parameter number and benchmark score compared to other models.
* **Clustering:** Several models (LMSys Vicuna 33B, Meta Llama 2 70B, Meta CodeLlama 34B, Hugging Face Guanaco 65B) are clustered together with similar release times, benchmark scores, and low parameter numbers.
### Interpretation
The bubble chart suggests that there is a positive correlation between the release time, parameter number, and LLM Agent Benchmark Score. Newer models tend to perform better, and models with more parameters generally achieve higher benchmark scores. OpenAI's GPT-4* is a clear outlier, demonstrating a significant leap in both parameter number and performance compared to other models. The clustering of several models around similar release times and low benchmark scores indicates a competitive landscape with varying degrees of success. The asterisk next to some model names (Anthropic Claude*, Anthropic Claude-2*, OpenAI GPT-3.5 Turbo*, OpenAI GPT-4*) might indicate specific versions or configurations of those models.