\n
## Chart: Single Line Graph
### Overview
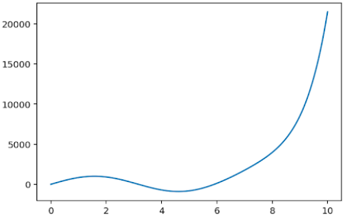
The image displays a line graph with a single data series plotted against an unspecified variable on the x-axis and a numerical value on the y-axis. The graph shows an initial decrease, followed by a minimum, and then a rapid increase.
### Components/Axes
* **X-axis:** Ranges from 0 to 10, with tick marks at integer values. No label is present.
* **Y-axis:** Ranges from 0 to 20000, with tick marks at 5000-unit intervals. No label is present.
* **Data Series:** A single blue line representing the plotted data.
* **Legend:** No legend is present.
### Detailed Analysis
The blue line begins at approximately (0, 500). It initially decreases to a minimum value around (3, -500). From this minimum, the line increases, becoming steeper as the x-value increases. At x = 8, the y-value is approximately 5000. The line continues to increase rapidly, reaching approximately (10, 20000).
Here's a breakdown of approximate data points:
* (0, 500)
* (1, 1500)
* (2, 2000)
* (3, -500)
* (4, 0)
* (5, 500)
* (6, 1500)
* (7, 3000)
* (8, 5000)
* (9, 10000)
* (10, 20000)
The line exhibits a clear trend: a decrease to a minimum, followed by exponential growth.
### Key Observations
* The graph shows a significant change in the rate of increase after x = 6.
* The minimum value of the function is negative, indicating a portion of the curve lies below the x-axis.
* The rapid increase suggests a potential exponential or polynomial relationship.
### Interpretation
The graph likely represents a function that initially decreases before experiencing a period of growth. The shape of the curve suggests a relationship where the rate of change is initially negative, reaches a minimum, and then becomes increasingly positive. This could model various phenomena, such as population growth after an initial decline, the learning curve of a skill, or the acceleration of a process. Without axis labels, the specific meaning of the graph remains ambiguous, but the mathematical relationship is clearly non-linear. The absence of a legend is not problematic as there is only one data series. The graph demonstrates a function with a local minimum and a rapid increase towards larger values.