## Line Graph: Sales Growth Over Time
### Overview
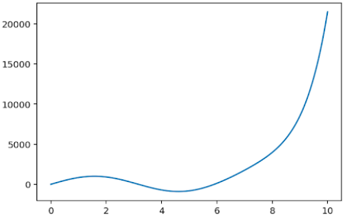
The line graph depicts the sales growth of a product over a period of 10 months. The x-axis represents time in months, while the y-axis represents sales in thousands of units. The blue line indicates the sales trend, showing an initial slow growth, followed by a rapid increase, and then a slight decline towards the end of the period.
### Components/Axes
- **X-axis**: Represents time in months, ranging from 0 to 10.
- **Y-axis**: Represents sales in thousands of units, ranging from 0 to 20,000.
- **Legend**: There is no legend visible in the image.
- **Title**: The title of the graph is not visible in the image.
### Detailed Analysis or ### Content Details
- **Initial Slow Growth**: The sales start at around 5,000 units in month 0 and gradually increase to about 10,000 units in month 2.
- **Rapid Increase**: From month 2 to month 6, the sales grow exponentially, reaching approximately 15,000 units.
- **Slight Decline**: In month 10, the sales begin to decrease slightly, ending at around 12,000 units.
### Key Observations
- **Exponential Growth**: The most striking feature is the exponential growth in sales from month 2 to month 6.
- **Decline**: There is a minor decline in sales towards the end of the period.
### Interpretation
The data suggests that the product experienced a significant boost in sales during the period, particularly from month 2 to month 6. This could be due to various factors such as marketing campaigns, product improvements, or increased demand. However, the slight decline in month 10 might indicate a need for further analysis to understand the underlying reasons for this decrease.