## Surface Charts: Attack vs. Defense Budget Impact on HIT@5
### Overview
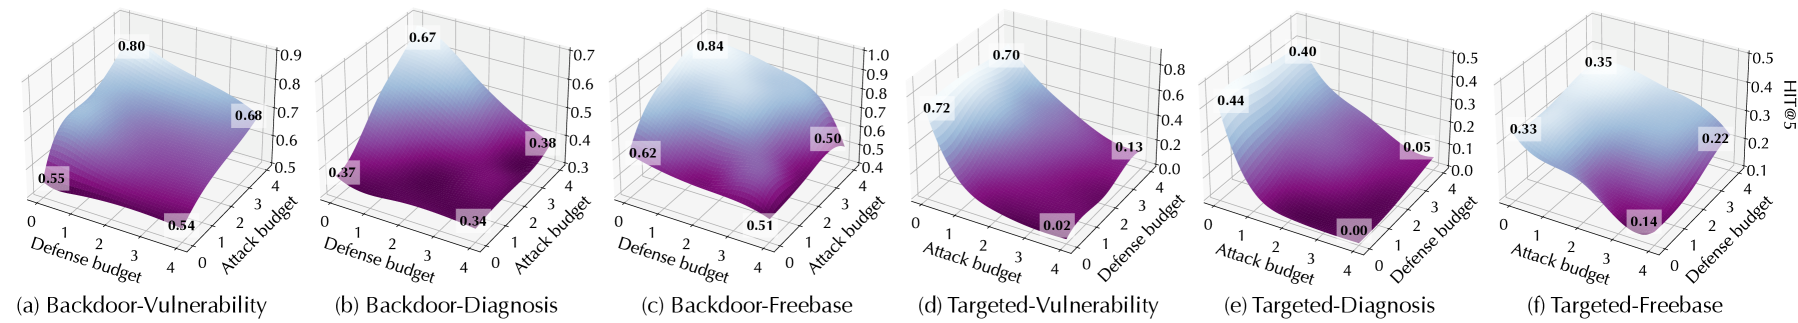
The image presents six 3D surface charts, each visualizing the relationship between attack budget, defense budget, and HIT@5 (Hit Rate at 5) for different scenarios: Backdoor-Vulnerability, Backdoor-Diagnosis, Backdoor-Freebase, Targeted-Vulnerability, Targeted-Diagnosis, and Targeted-Freebase. The x and y axes represent the attack and defense budgets, respectively, ranging from 0 to 4. The z-axis represents the HIT@5 score, ranging from 0 to 1.0. The surface color transitions from purple (low HIT@5) to light blue (high HIT@5), indicating the performance level.
### Components/Axes
* **X-axis:** Attack budget (0 to 4)
* **Y-axis:** Defense budget (0 to 4)
* **Z-axis:** HIT@5 (Hit Rate at 5), ranging from 0 to 1.0, with varying maximum values depending on the chart.
* **Surface Color:** Purple (low HIT@5) to light blue (high HIT@5)
### Detailed Analysis
**Chart (a): Backdoor-Vulnerability**
* Trend: HIT@5 increases as the defense budget increases, and also increases as the attack budget increases.
* Data Points:
* (Attack Budget 0, Defense Budget 0): HIT@5 ≈ 0.55
* (Attack Budget 4, Defense Budget 0): HIT@5 ≈ 0.54
* (Attack Budget 0, Defense Budget 4): HIT@5 ≈ 0.80
* (Attack Budget 0, Defense Budget 4): HIT@5 ≈ 0.68
**Chart (b): Backdoor-Diagnosis**
* Trend: HIT@5 increases as the defense budget increases, and also increases as the attack budget increases.
* Data Points:
* (Attack Budget 0, Defense Budget 0): HIT@5 ≈ 0.37
* (Attack Budget 4, Defense Budget 0): HIT@5 ≈ 0.34
* (Attack Budget 0, Defense Budget 4): HIT@5 ≈ 0.67
* (Attack Budget 4, Defense Budget 4): HIT@5 ≈ 0.38
**Chart (c): Backdoor-Freebase**
* Trend: HIT@5 increases as the defense budget increases, and also increases as the attack budget increases.
* Data Points:
* (Attack Budget 0, Defense Budget 0): HIT@5 ≈ 0.62
* (Attack Budget 4, Defense Budget 0): HIT@5 ≈ 0.51
* (Attack Budget 0, Defense Budget 4): HIT@5 ≈ 0.84
* (Attack Budget 4, Defense Budget 4): HIT@5 ≈ 0.50
**Chart (d): Targeted-Vulnerability**
* Trend: HIT@5 increases as the defense budget increases, and also increases as the attack budget increases.
* Data Points:
* (Attack Budget 0, Defense Budget 0): HIT@5 ≈ 0.72
* (Attack Budget 4, Defense Budget 0): HIT@5 ≈ 0.02
* (Attack Budget 0, Defense Budget 4): HIT@5 ≈ 0.70
* (Attack Budget 4, Defense Budget 4): HIT@5 ≈ 0.13
**Chart (e): Targeted-Diagnosis**
* Trend: HIT@5 increases as the defense budget increases, and also increases as the attack budget increases.
* Data Points:
* (Attack Budget 0, Defense Budget 0): HIT@5 ≈ 0.44
* (Attack Budget 4, Defense Budget 0): HIT@5 ≈ 0.00
* (Attack Budget 0, Defense Budget 4): HIT@5 ≈ 0.40
* (Attack Budget 4, Defense Budget 4): HIT@5 ≈ 0.05
**Chart (f): Targeted-Freebase**
* Trend: HIT@5 increases as the defense budget increases, and also increases as the attack budget increases.
* Data Points:
* (Attack Budget 0, Defense Budget 0): HIT@5 ≈ 0.33
* (Attack Budget 4, Defense Budget 0): HIT@5 ≈ 0.14
* (Attack Budget 0, Defense Budget 4): HIT@5 ≈ 0.35
* (Attack Budget 4, Defense Budget 4): HIT@5 ≈ 0.22
### Key Observations
* In all scenarios, increasing the defense budget generally leads to a higher HIT@5 score.
* The Backdoor scenarios (a, b, c) generally have higher HIT@5 scores compared to the Targeted scenarios (d, e, f).
* The Targeted-Diagnosis scenario (e) shows the lowest HIT@5 scores overall.
### Interpretation
The charts illustrate the impact of attack and defense budgets on the success rate (HIT@5) of different attack scenarios. The Backdoor scenarios appear to be more resilient, maintaining a higher HIT@5 even with varying attack and defense budgets. In contrast, the Targeted scenarios are more sensitive to the attack and defense budgets, with Targeted-Diagnosis being particularly vulnerable. This suggests that different attack strategies require different defense mechanisms and resource allocation strategies. The data indicates that investing in defense is generally beneficial, but the optimal allocation depends on the specific threat model.