\n
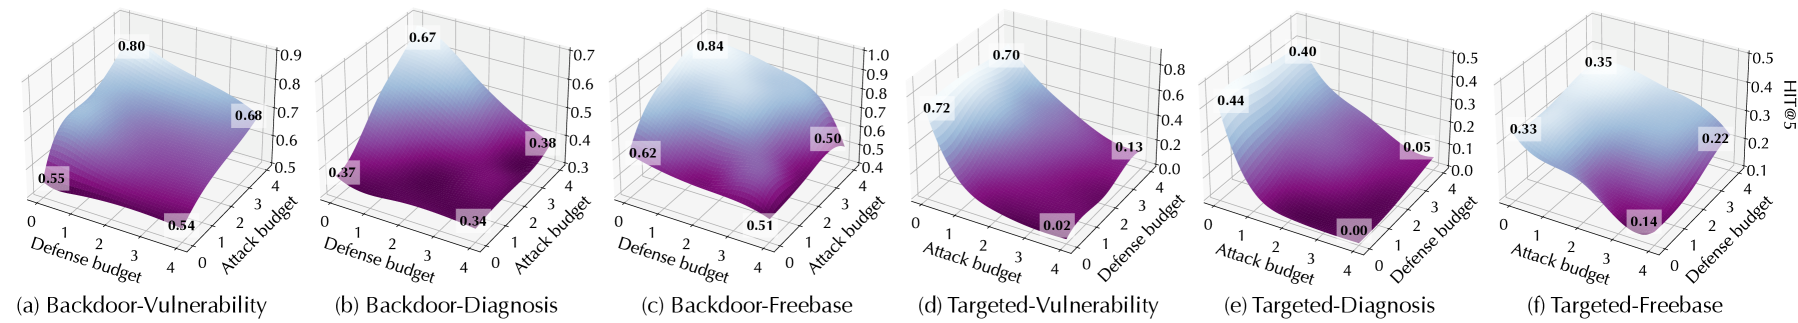
## 3D Surface Plots: Attack and Defense Budget Impact on Threat (H-Score)
### Overview
The image presents six 3D surface plots, each representing the relationship between "Attack budget" (x-axis), "Defense budget" (y-axis), and a threat metric "H-Score" (z-axis, represented by color). Each plot corresponds to a different scenario: (a) Backdoor-Vulnerability, (b) Backdoor-Diagnosis, (c) Backdoor-Freebase, (d) Targeted-Vulnerability, (e) Targeted-Diagnosis, and (f) Targeted-Freebase. The plots visualize how the H-Score changes as both attack and defense budgets are varied.
### Components/Axes
* **X-axis:** "Attack budget" - Scale ranges from 0 to 4.
* **Y-axis:** "Defense budget" - Scale ranges from 0 to 4.
* **Z-axis:** "H-Score" - Represented by the height of the surface and color gradient. The scale is not explicitly labeled, but values range approximately from 0 to 1.1.
* **Plots:** Six individual 3D surface plots, labeled (a) through (f) as described above.
* **Color Gradient:** A blue-to-red gradient is used to represent the H-Score, with blue indicating lower values and red indicating higher values.
### Detailed Analysis or Content Details
**Plot (a): Backdoor-Vulnerability**
* The surface generally slopes upwards from left to right and from back to front.
* The highest H-Score (approximately 0.99) is located near Attack budget = 4 and Defense budget = 4.
* The lowest H-Score (approximately 0.55) is located near Attack budget = 0 and Defense budget = 0.
* Notable data points: (0,0) = 0.55, (4,0) = 0.37, (0,4) = 0.8, (4,4) = 0.99.
**Plot (b): Backdoor-Diagnosis**
* The surface has a peak in the center, indicating a higher H-Score with moderate attack and defense budgets.
* The highest H-Score (approximately 0.7) is located near Attack budget = 2 and Defense budget = 2.
* The lowest H-Score (approximately 0.34) is located near Attack budget = 4 and Defense budget = 0.
* Notable data points: (0,0) = 0.38, (4,0) = 0.34, (0,4) = 0.62, (4,4) = 0.67, (2,2) = 0.7.
**Plot (c): Backdoor-Freebase**
* Similar to (b), this plot also exhibits a peak in the center.
* The highest H-Score (approximately 0.84) is located near Attack budget = 2 and Defense budget = 2.
* The lowest H-Score (approximately 0.51) is located near Attack budget = 4 and Defense budget = 0.
* Notable data points: (0,0) = 0.6, (4,0) = 0.51, (0,4) = 0.7, (4,4) = 0.72, (2,2) = 0.84.
**Plot (d): Targeted-Vulnerability**
* The surface slopes upwards from left to right, but is relatively flat.
* The highest H-Score (approximately 0.70) is located near Attack budget = 4 and Defense budget = 4.
* The lowest H-Score (approximately 0.02) is located near Attack budget = 0 and Defense budget = 0.
* Notable data points: (0,0) = 0.02, (4,0) = 0.1, (0,4) = 0.44, (4,4) = 0.70.
**Plot (e): Targeted-Diagnosis**
* The surface has a peak in the center, similar to (b) and (c).
* The highest H-Score (approximately 0.49) is located near Attack budget = 2 and Defense budget = 2.
* The lowest H-Score (approximately 0.00) is located near Attack budget = 4 and Defense budget = 0.
* Notable data points: (0,0) = 0.08, (4,0) = 0.00, (0,4) = 0.33, (4,4) = 0.40, (2,2) = 0.49.
**Plot (f): Targeted-Freebase**
* The surface has a peak in the center, similar to (b) and (c).
* The highest H-Score (approximately 0.35) is located near Attack budget = 2 and Defense budget = 2.
* The lowest H-Score (approximately 0.14) is located near Attack budget = 4 and Defense budget = 0.
* Notable data points: (0,0) = 0.22, (4,0) = 0.14, (0,4) = 0.33, (4,4) = 0.35, (2,2) = 0.35.
### Key Observations
* Plots (b), (c), and (e) all exhibit a peak in the center, suggesting that a moderate balance between attack and defense budgets results in the highest H-Score for those scenarios.
* Plots (a) and (d) show an increasing H-Score as both attack and defense budgets increase.
* The H-Scores are generally lower for the "Targeted" scenarios (d, e, f) compared to the "Backdoor" scenarios (a, b, c).
* The lowest H-Scores consistently occur when both attack and defense budgets are minimal.
### Interpretation
These plots demonstrate the impact of attack and defense budgets on the H-Score, a metric representing a threat level. The different scenarios (Backdoor vs. Targeted, and the specific knowledge source - Vulnerability, Diagnosis, Freebase) reveal varying vulnerabilities. The plots suggest that for "Backdoor" scenarios, increasing both attack and defense budgets generally increases the threat (H-Score), potentially indicating that defenses are being circumvented by more sophisticated attacks. Conversely, for "Targeted" scenarios, a balanced approach (moderate attack and defense) appears to be most vulnerable, possibly because targeted attacks are more effective when defenses are present but not overwhelming. The lower H-Scores in the "Targeted" scenarios overall suggest that these attacks are inherently less effective than "Backdoor" attacks, or that the scenarios are modeled differently. The peak in the center of plots (b), (c), and (e) suggests a sweet spot where a moderate level of both attack and defense leads to the highest threat, potentially because the defense provides enough information for a targeted attack to be successful. The data suggests that the optimal strategy for mitigating these threats depends heavily on the specific scenario and the nature of the attack.