## 3D Surface Plots: Backdoor and Targeted Attack Metrics (Vulnerability, Diagnosis, Freebase)
### Overview
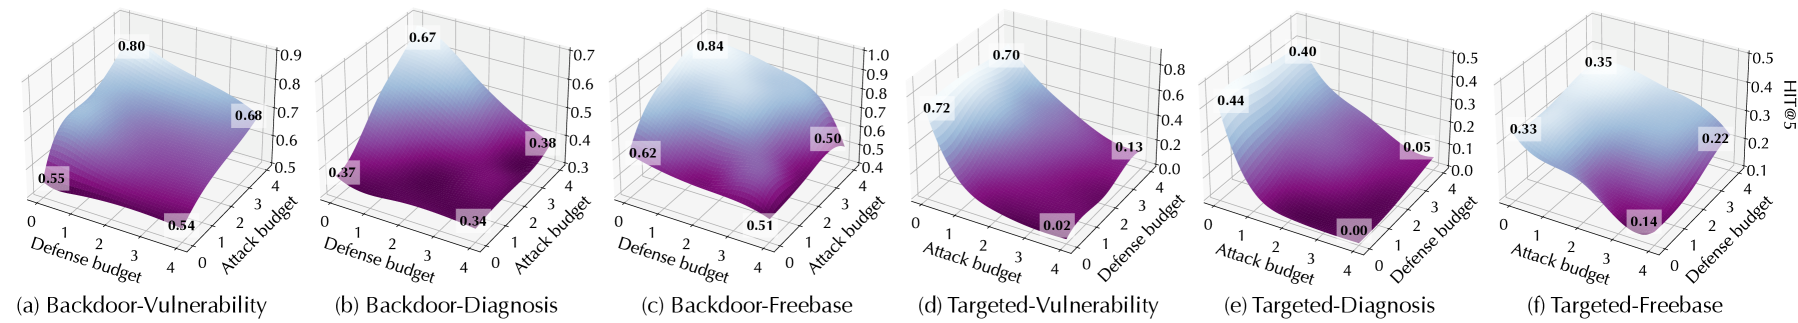
The image contains six 3D surface plots (labeled (a)–(f)) illustrating the relationship between **Attack budget** (x-axis, 0–4), **Defense budget** (y-axis, 0–4), and a performance metric (z-axis, varying ranges) for backdoor and targeted attacks across three datasets: *Vulnerability*, *Diagnosis*, and *Freebase*. Each plot uses a purple-to-blue color gradient (purple = lower metric, blue = higher metric) to visualize the surface.
### Components/Axes
- **Axes (all plots):**
- X-axis: *Attack budget* (0, 1, 2, 3, 4)
- Y-axis: *Defense budget* (0, 1, 2, 3, 4)
- Z-axis: Metric (e.g., attack success rate, vulnerability score) with ranges:
- (a) 0.5–0.9; (b) 0.3–0.7; (c) 0.4–1.0; (d) 0.0–0.8; (e) 0.0–0.5; (f) 0.1–0.5
- **Color Gradient:** Purple (low metric) to blue (high metric) across all surfaces.
- **Labeled Points:** Each plot has 4 labeled points (bottom, left, right, top) with numerical values (e.g., 0.54, 0.80 in (a)).
### Detailed Analysis (Per Subplot)
#### (a) Backdoor-Vulnerability
- **Trend:** Surface rises from the bottom (0.54) to the top (0.80), with intermediate values at the left (0.55) and right (0.68).
- **Key Values:** Bottom (0.54), Left (0.55), Right (0.68), Top (0.80).
#### (b) Backdoor-Diagnosis
- **Trend:** Surface rises from the bottom (0.34) to the top (0.67), with intermediate values at the left (0.37) and right (0.38).
- **Key Values:** Bottom (0.34), Left (0.37), Right (0.38), Top (0.67).
#### (c) Backdoor-Freebase
- **Trend:** Surface rises from the bottom (0.51) to the top (0.84), with intermediate values at the left (0.62) and right (0.50).
- **Key Values:** Bottom (0.51), Left (0.62), Right (0.50), Top (0.84).
#### (d) Targeted-Vulnerability
- **Trend:** Surface has a low point (0.02) at the bottom, rises to the left (0.72) and top (0.70), with an intermediate value at the right (0.13).
- **Key Values:** Bottom (0.02), Left (0.72), Right (0.13), Top (0.70).
#### (e) Targeted-Diagnosis
- **Trend:** Surface has a very low point (0.00) at the bottom, rises to the left (0.44) and top (0.40), with an intermediate value at the right (0.05).
- **Key Values:** Bottom (0.00), Left (0.44), Right (0.05), Top (0.40).
#### (f) Targeted-Freebase
- **Trend:** Surface rises from the bottom (0.14) to the top (0.35), with intermediate values at the left (0.33) and right (0.22).
- **Key Values:** Bottom (0.14), Left (0.33), Right (0.22), Top (0.35).
### Key Observations
- **Backdoor vs. Targeted:** Backdoor attacks (a–c) generally have higher metric values (e.g., top values 0.67–0.84) than targeted attacks (d–f, top values 0.35–0.70), except (d) which has a high left value (0.72).
- **Dataset Variation:** Freebase (c, f) shows higher top values than Vulnerability (a, d) and Diagnosis (b, e) in backdoor attacks; targeted attacks on Freebase (f) have moderate values.
- **Low Points:** Targeted attacks (d, e) have very low bottom values (0.02, 0.00), indicating minimal metric at low attack/defense budgets.
### Interpretation
These plots likely represent the effectiveness of backdoor vs. targeted attacks (or defense) across datasets, with the metric (e.g., attack success rate, vulnerability score) varying with attack/defense budgets. The purple-blue gradient shows how the metric changes with budget combinations: higher blue (top) suggests stronger performance (e.g., more successful attack or higher vulnerability) at higher budgets.
For example, in (a) Backdoor-Vulnerability, the top (0.80) at high attack/defense budgets suggests strong backdoor effectiveness, while the bottom (0.54) at low budgets is weaker. Targeted attacks (d, e) show more variability, with very low values at low budgets, indicating they are less effective (or more vulnerable) at low budgets.
This data helps compare attack/defense strategies across datasets, identifying which datasets are more vulnerable to backdoor vs. targeted attacks and how budget allocation impacts performance.