\n
## Diagram: Network Transformation
### Overview
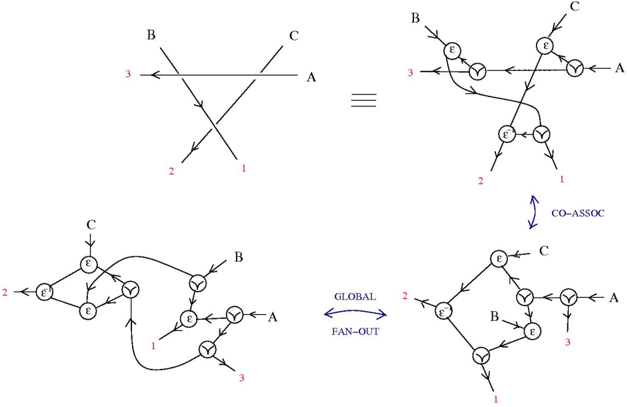
The image presents a series of diagrams illustrating a transformation of a network represented by lines and numbers into a more complex network of nodes and edges. The diagrams demonstrate a concept of "co-assoc" and "global fan-out" relating to network structure. The initial network is shown on the left, and its equivalent representation is shown on the right. Two further transformations are shown below, with arrows indicating the relationship between "global" and "fan-out".
### Components/Axes
The diagrams consist of:
* **Lines:** Representing connections or relationships between elements (A, B, C).
* **Numbers (1, 2, 3):** Labels associated with the lines, likely indicating some form of weighting or identification.
* **Nodes:** Represented by circles with the symbol "ε" inside.
* **Arrows:** Indicating the direction of relationships or transformations.
* **Labels:** "A", "B", "C" identifying network elements.
* **Textual Annotations:** "CO-ASSOC", "GLOBAL", "FAN-OUT".
### Detailed Analysis or Content Details
**Top Row:**
* **Left Diagram:** Three lines are shown. Line B is horizontal and labeled with "3". Line C is angled downwards and labeled with "2". Line A is angled upwards and labeled with "1". The lines intersect.
* **Right Diagram:** This diagram represents the equivalent network of the left diagram. It consists of nodes connected by edges.
* Line B (labeled "3") is represented by a node with "ε" connected to a node with "A".
* Line C (labeled "2") is represented by a node with "ε" connected to a node with "A".
* Line A (labeled "1") is represented by a node with "ε" connected to a node with "A".
* There are connections between the "ε" nodes.
**Bottom Row:**
* **Left Diagram:** A more complex network with nodes and edges.
* Line C (labeled "2") enters from the top-left and connects to a node with "ε".
* Line B (labeled "3") enters from the top-right and connects to a node with "ε".
* Line A (labeled "1") exits from the bottom-right and connects to a node with "ε".
* There are multiple connections between the "ε" nodes.
* **Right Diagram:** Another network representation.
* Line C (labeled "2") enters from the top-left and connects to a node with "ε".
* Line B (labeled "3") enters from the top-right and connects to a node with "ε".
* Line A (labeled "1") exits from the bottom-right and connects to a node with "ε".
* There are multiple connections between the "ε" nodes.
**Annotations:**
* A bidirectional arrow labeled "CO-ASSOC" is positioned between the top two diagrams.
* A bidirectional arrow labeled "GLOBAL <-> FAN-OUT" is positioned between the bottom two diagrams.
### Key Observations
* The diagrams demonstrate a transformation from a simple line-based network to a more complex node-and-edge network.
* The numbers (1, 2, 3) appear to be preserved during the transformation, acting as identifiers.
* The "ε" symbol consistently appears within the nodes, suggesting it represents a common element or operation.
* The "CO-ASSOC" annotation suggests a relationship of co-association between the initial line network and its node-based equivalent.
* The "GLOBAL <-> FAN-OUT" annotation indicates a relationship between the two bottom diagrams, potentially representing a global view versus a fan-out distribution.
### Interpretation
The diagrams likely illustrate a method for representing network relationships in a more detailed and structured manner. The initial line network is a simplified representation, while the node-and-edge network provides a more granular view of the connections and interactions. The "ε" symbol could represent a fundamental unit of interaction or a transformation operation. The "CO-ASSOC" annotation suggests that the node-and-edge network is a faithful representation of the relationships present in the original line network. The "GLOBAL <-> FAN-OUT" annotation suggests that the network can be viewed from a global perspective or broken down into a fan-out distribution, potentially for analysis or optimization. The diagrams are abstract and do not provide specific data values, but rather demonstrate a conceptual transformation of network representation. The diagrams are likely part of a theoretical framework for network analysis or design.