\n
## Bar Chart: Activation Function Performance Comparison
### Overview
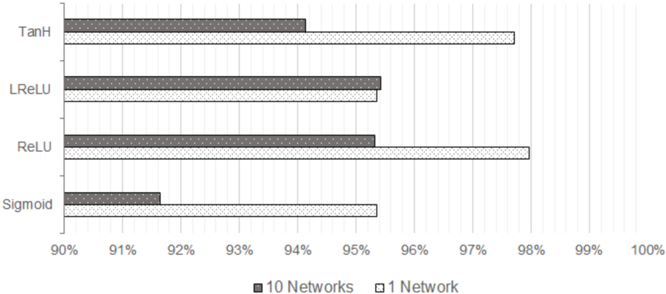
This image presents a bar chart comparing the performance of four different activation functions (Tanh, LReLU, ReLU, and Sigmoid) across two experimental setups: training 10 neural networks versus training a single neural network. Performance is measured as a percentage, likely representing accuracy or a similar metric.
### Components/Axes
* **Y-axis:** Lists the activation functions: Tanh, LReLU, ReLU, Sigmoid.
* **X-axis:** Represents the performance percentage, ranging from 90% to 100%, with markings at 91%, 92%, 93%, 94%, 95%, 96%, 97%, 98%, 99%, and 100%.
* **Legend:** Located at the bottom-center of the chart.
* Dark Gray Bars: Represent the performance of "10 Networks".
* Light Gray Bars: Represent the performance of "1 Network".
### Detailed Analysis
Let's analyze each activation function's performance:
* **Tanh:**
* 10 Networks: Approximately 94.5% (dark gray bar extends to roughly 94.5 on the x-axis).
* 1 Network: Approximately 97.5% (light gray bar extends to roughly 97.5 on the x-axis).
* **LReLU:**
* 10 Networks: Approximately 94.2% (dark gray bar extends to roughly 94.2 on the x-axis).
* 1 Network: Approximately 95.5% (light gray bar extends to roughly 95.5 on the x-axis).
* **ReLU:**
* 10 Networks: Approximately 94% (dark gray bar extends to roughly 94 on the x-axis).
* 1 Network: Approximately 98% (light gray bar extends to roughly 98 on the x-axis).
* **Sigmoid:**
* 10 Networks: Approximately 91.5% (dark gray bar extends to roughly 91.5 on the x-axis).
* 1 Network: Approximately 95% (light gray bar extends to roughly 95 on the x-axis).
The bars for "1 Network" consistently outperform the bars for "10 Networks" across all activation functions.
### Key Observations
* ReLU achieves the highest performance when training a single network (approximately 98%).
* Sigmoid consistently shows the lowest performance, especially when training 10 networks (approximately 91.5%).
* The difference in performance between training 10 networks and 1 network is most pronounced for ReLU and Tanh.
* The performance differences between the activation functions are relatively small, all falling within a 6.5% range.
### Interpretation
The data suggests that, in this experimental setup, training a single neural network yields better performance than training an ensemble of 10 networks. This could be due to factors like the specific dataset used, the network architecture, or the training parameters. The superior performance of ReLU when training a single network indicates that it might be a more effective choice for this particular task. The consistently lower performance of Sigmoid suggests it may be less suitable for this type of problem, potentially due to the vanishing gradient problem. The fact that the performance gap between single and multiple networks is larger for ReLU and Tanh could indicate that these activation functions are more sensitive to the number of networks in the ensemble. Further investigation would be needed to understand the underlying reasons for these observations and to determine the generalizability of these findings.