## Horizontal Bar Chart: Performance Comparison of Neural Network Activation Functions
### Overview
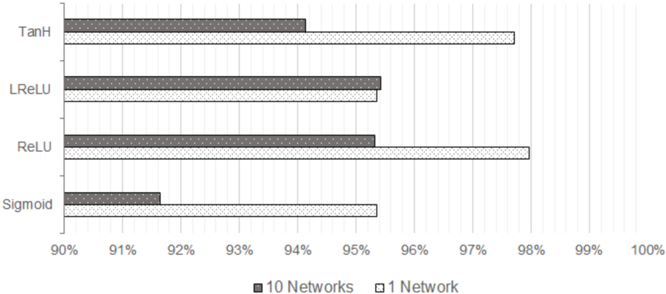
The image displays a horizontal bar chart comparing the performance (likely accuracy, given the percentage scale) of four different neural network activation functions. The comparison is made between two scenarios: using an ensemble of "10 Networks" versus a single "1 Network". The chart suggests that for most activation functions shown, a single network achieves higher performance than the ensemble of ten.
### Components/Axes
* **Chart Type:** Horizontal grouped bar chart.
* **Y-Axis (Categories):** Lists four activation functions. From top to bottom:
* TanH
* LReLU (Leaky ReLU)
* ReLU
* Sigmoid
* **X-Axis (Scale):** Represents a percentage, ranging from 90% to 100% in increments of 1%. The axis is labeled with markers at 90%, 91%, 92%, 93%, 94%, 95%, 96%, 97%, 98%, 99%, and 100%.
* **Legend:** Positioned at the bottom center of the chart.
* **Dark Gray Bar:** Labeled "10 Networks".
* **Light Gray Bar:** Labeled "1 Network".
* **Data Series:** For each activation function on the Y-axis, there are two bars grouped together: a dark gray bar (10 Networks) on top and a light gray bar (1 Network) directly below it.
### Detailed Analysis
**Trend Verification:** For all four activation functions, the "1 Network" (light gray) bar extends further to the right (higher percentage) than its corresponding "10 Networks" (dark gray) bar. This indicates a consistent visual trend where the single network outperforms the 10-network ensemble in this specific evaluation.
**Data Point Extraction (Approximate Values):**
* **TanH:**
* 10 Networks: ~94.2%
* 1 Network: ~97.8%
* **LReLU:**
* 10 Networks: ~95.5%
* 1 Network: ~95.5% (The bars appear nearly identical in length, with the 1 Network bar possibly a fraction longer).
* **ReLU:**
* 10 Networks: ~95.5%
* 1 Network: ~98.0%
* **Sigmoid:**
* 10 Networks: ~91.7%
* 1 Network: ~95.4%
### Key Observations
1. **Performance Hierarchy:** In the "1 Network" scenario, the performance order from highest to lowest is: ReLU (~98.0%) > TanH (~97.8%) > LReLU (~95.5%) ≈ Sigmoid (~95.4%).
2. **Ensemble Impact:** The negative impact of using "10 Networks" versus "1 Network" is most pronounced for TanH and ReLU, where the performance drop is approximately 3.6% and 2.5% respectively. For Sigmoid, the drop is about 3.7%. LReLU shows negligible difference between the two scenarios.
3. **Lowest Performer:** The Sigmoid activation function, particularly in the "10 Networks" configuration (~91.7%), is the clear outlier with the lowest performance on the chart.
4. **Highest Performer:** The ReLU activation function with a single network (~98.0%) achieves the highest performance value shown.
### Interpretation
This chart presents a counter-intuitive finding: for the given task and model architecture, using an ensemble of ten networks consistently yields lower performance than using a single network across all tested activation functions. This could suggest several possibilities:
* **Overfitting:** The ensemble of ten networks may be overfitting to the training data more severely than a single network, leading to poorer generalization on the validation/test set represented by this percentage metric.
* **Ensemble Method:** The method used to combine the predictions of the ten networks (e.g., simple averaging) might be suboptimal or even detrimental for this specific problem.
* **Task Specificity:** The result highlights that ensemble methods are not a universal guarantee for performance improvement and their effectiveness is highly dependent on the task, data, and model diversity.
The data strongly advocates for the use of a single network with ReLU or TanH activation for this particular application, as they provide the highest performance. The poor performance of Sigmoid aligns with common deep learning practice, which often favors ReLU-based activations due to better gradient flow and training dynamics. The near-identical performance of LReLU in both scenarios is an interesting anomaly that might warrant further investigation into its training stability.