## Density Plot: Duration Distribution
### Overview
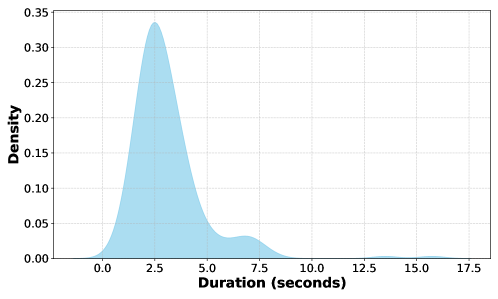
The image depicts a density plot showing the distribution of durations measured in seconds. The plot features a single blue-shaded curve representing the probability density function of the data. The x-axis represents duration in seconds, while the y-axis represents density values.
### Components/Axes
- **X-axis (Duration)**: Labeled "Duration (seconds)" with numerical markers at 0.0, 2.5, 5.0, 7.5, 10.0, 12.5, 15.0, and 17.5 seconds.
- **Y-axis (Density)**: Labeled "Density" with values ranging from 0.00 to 0.35 in increments of 0.05.
- **Legend**: No explicit legend is present, but the blue-shaded area corresponds to the primary data series.
- **Grid**: Light gray grid lines are visible in the background for reference.
### Detailed Analysis
1. **Primary Peak**:
- The curve reaches its maximum density of approximately **0.34** at **2.5 seconds**.
- This peak dominates the distribution, indicating the highest probability density occurs at this duration.
2. **Secondary Peak**:
- A smaller secondary peak appears near **6 seconds** with a density of approximately **0.03**.
- This peak is significantly lower than the primary peak, suggesting a less frequent but notable occurrence.
3. **Tails**:
- The left tail (durations < 2.5s) is negligible, with density approaching 0.
- The right tail (durations > 6s) declines gradually, with density dropping below 0.01 after 10 seconds and nearly zero beyond 15 seconds.
### Key Observations
- The distribution is **unimodal** with a dominant peak at 2.5 seconds, though a minor secondary peak at 6 seconds introduces slight bimodality.
- The distribution is **right-skewed**, with a long tail extending toward higher durations.
- The density drops sharply after the primary peak, indicating most data points cluster tightly around 2.5 seconds.
### Interpretation
This density plot suggests that the majority of observed durations are concentrated around **2.5 seconds**, with a mode at this value. The secondary peak at 6 seconds may represent a secondary process or outlier group, though its low density (0.03) indicates it accounts for a small fraction of the data. The right-skewed tail implies rare instances of significantly longer durations, potentially outliers or edge cases in the dataset. The sharp decline after the primary peak highlights the rarity of durations exceeding 6 seconds. This could reflect a system or process with a typical operational time of ~2.5 seconds, with occasional deviations.