\n
## Grouped Bar Chart: Model Accuracy by First Step Correctness
### Overview
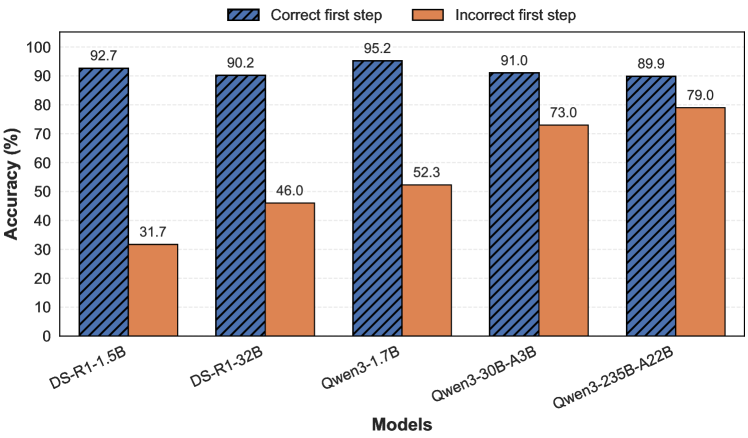
This image displays a grouped bar chart comparing the accuracy (in percentage) of five different AI models under two conditions: when the model's first step is correct versus when it is incorrect. The chart visually demonstrates the performance impact of initial step correctness across models of varying sizes.
### Components/Axes
* **Chart Type:** Grouped vertical bar chart.
* **X-Axis (Horizontal):**
* **Label:** "Models"
* **Categories (from left to right):** DS-R1-1.5B, DS-R1-32B, Qwen3-1.7B, Qwen3-30B-A3B, Qwen3-235B-A22B.
* **Y-Axis (Vertical):**
* **Label:** "Accuracy (%)"
* **Scale:** Linear scale from 0 to 100, with major tick marks every 10 units (0, 10, 20, ..., 100).
* **Legend:**
* **Position:** Centered at the top of the chart area.
* **Series 1:** "Correct first step" - Represented by blue bars with a diagonal hatching pattern (///).
* **Series 2:** "Incorrect first step" - Represented by solid orange bars.
* **Data Labels:** The exact accuracy percentage is printed above each bar.
### Detailed Analysis
The chart presents paired data for each of the five models. For every model, the "Correct first step" condition yields significantly higher accuracy than the "Incorrect first step" condition.
**Data Points by Model (Left to Right):**
1. **DS-R1-1.5B**
* Correct first step (Blue, hatched): **92.7%**
* Incorrect first step (Orange, solid): **31.7%**
* *Visual Trend:* The blue bar is substantially taller than the orange bar, indicating a large performance drop when the first step is incorrect.
2. **DS-R1-32B**
* Correct first step (Blue, hatched): **90.2%**
* Incorrect first step (Orange, solid): **46.0%**
* *Visual Trend:* Similar pattern to the first model, with a large gap between the two conditions.
3. **Qwen3-1.7B**
* Correct first step (Blue, hatched): **95.2%**
* Incorrect first step (Orange, solid): **52.3%**
* *Visual Trend:* This model achieves the highest accuracy in the "Correct first step" condition among all models shown. The gap remains large.
4. **Qwen3-30B-A3B**
* Correct first step (Blue, hatched): **91.0%**
* Incorrect first step (Orange, solid): **73.0%**
* *Visual Trend:* The gap between the two bars begins to narrow compared to the previous models. The "Incorrect first step" accuracy is notably higher here.
5. **Qwen3-235B-A22B**
* Correct first step (Blue, hatched): **89.9%**
* Incorrect first step (Orange, solid): **79.0%**
* *Visual Trend:* This model shows the smallest performance gap between the two conditions. The "Incorrect first step" accuracy is the highest of all models for that condition.
### Key Observations
1. **Universal Performance Drop:** All five models exhibit lower accuracy when their first step is incorrect compared to when it is correct.
2. **Magnitude of Drop Varies:** The performance penalty for an incorrect first step is most severe for the smaller DS-R1-1.5B model (a drop of ~61 percentage points) and least severe for the largest Qwen3-235B-A22B model (a drop of ~10.9 percentage points).
3. **Peak Performance:** The highest single accuracy value is 95.2% (Qwen3-1.7B, Correct first step).
4. **Lowest Performance:** The lowest single accuracy value is 31.7% (DS-R1-1.5B, Incorrect first step).
5. **Inverse Trend in "Incorrect" Condition:** While "Correct first step" accuracy is relatively stable across models (ranging from ~90% to ~95%), the "Incorrect first step" accuracy shows a clear upward trend as we move from left to right across the models (from 31.7% to 79.0%).
### Interpretation
The data strongly suggests that **the correctness of a model's initial reasoning step is a critical determinant of its final answer accuracy.** A faulty start severely compromises performance across all tested architectures.
Furthermore, the chart reveals a potential correlation between **model scale/complexity and robustness to initial errors.** The models on the right (particularly the Qwen3 series, especially the largest Qwen3-235B-A22B) maintain much higher accuracy even when starting with an incorrect step. This implies that larger or more advanced models may have a greater capacity to recover from early mistakes or employ alternative reasoning pathways, making them less brittle. The smaller DS-R1-1.5B model appears highly dependent on getting the first step right.
In a technical context, this underscores the importance of prompt engineering or chain-of-thought techniques that guide models toward a correct initial step, especially for smaller models. It also highlights a key advantage of scaling model size: improved error tolerance during multi-step reasoning tasks.