# Technical Document Extraction: Performance Analysis of RAG, DRAG, and IterDRAG Models
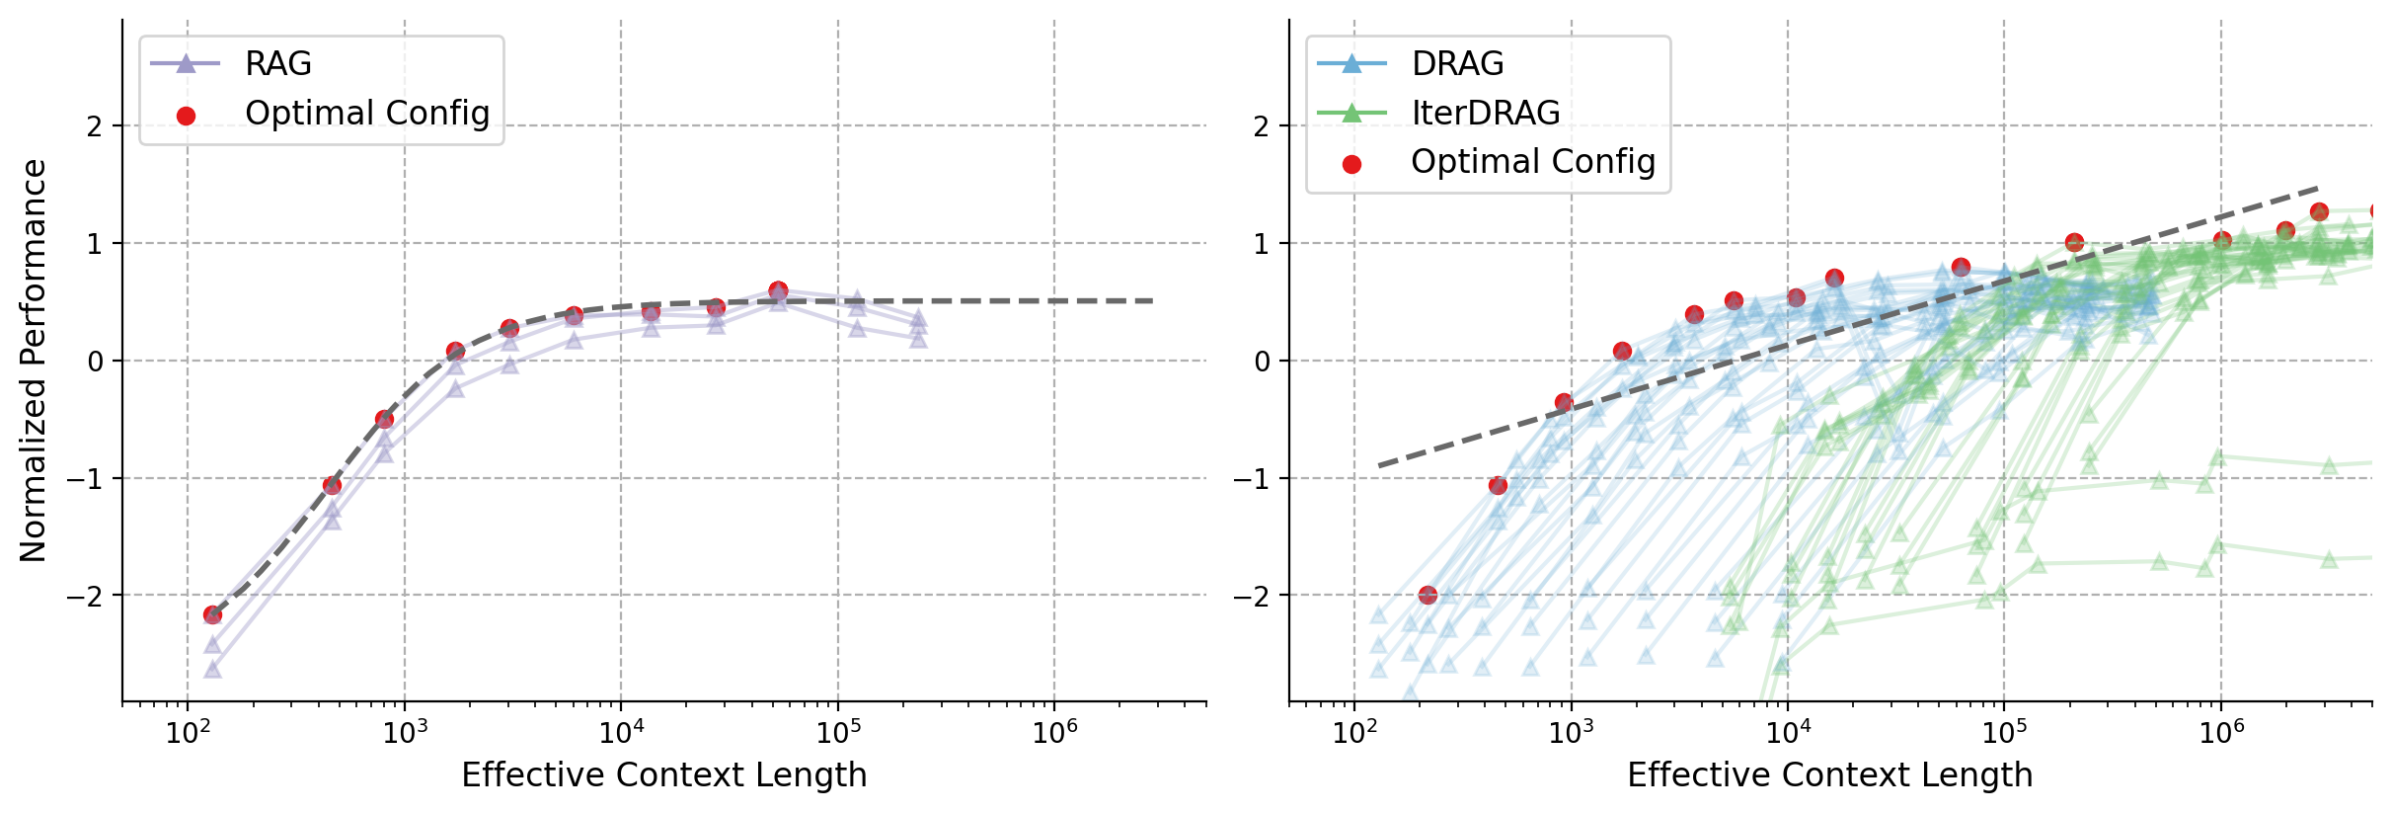
## Chart 1: RAG vs Optimal Configuration
### Spatial Grounding
- **Legend Position**: Top-left quadrant
- **Legend Colors**:
- Purple: RAG
- Red: Optimal Config
### Axis Labels
- **X-axis**: Effective Context Length (logarithmic scale: 10² to 10⁶)
- **Y-axis**: Normalized Performance (-2 to 2)
### Key Trends
1. **RAG (Purple Line)**:
- Initial slope: Steep upward trajectory from 10² to 10³
- Convergence: Gradual flattening between 10³ and 10⁴
- Plateau: Stable performance at ~0.5 normalized units after 10⁴
2. **Optimal Config (Red Dots)**:
- Consistent performance: Horizontal dashed line at ~0.5 normalized units
- Convergence point: RAG matches Optimal Config at ~10⁴ effective context length
### Data Points
- **RAG**:
- 10²: -1.8
- 10³: -0.2
- 10⁴: 0.5
- 10⁵: 0.5
- 10⁶: 0.5
- **Optimal Config**:
- Constant: 0.5 across all x-values
## Chart 2: DRAG vs IterDRAG vs Optimal Configuration
### Spatial Grounding
- **Legend Position**: Top-left quadrant
- **Legend Colors**:
- Blue: DRAG
- Green: IterDRAG
- Red: Optimal Config
### Axis Labels
- **X-axis**: Effective Context Length (logarithmic scale: 10² to 10⁶)
- **Y-axis**: Normalized Performance (-2 to 2)
### Key Trends
1. **DRAG (Blue Line)**:
- Initial slope: Steep upward trajectory from 10² to 10³
- Convergence: Gradual flattening between 10³ and 10⁴
- Plateau: Stable performance at ~0.8 normalized units after 10⁴
2. **IterDRAG (Green Line)**:
- Initial slope: Moderate upward trajectory from 10² to 10³
- Convergence: Accelerated improvement between 10³ and 10⁵
- Plateau: Stable performance at ~1.2 normalized units after 10⁵
3. **Optimal Config (Red Dots)**:
- Consistent performance: Horizontal dashed line at ~1.0 normalized units
- Convergence point: Both DRAG and IterDRAG approach Optimal Config at ~10⁵ effective context length
### Data Points
- **DRAG**:
- 10²: -1.5
- 10³: -0.3
- 10⁴: 0.8
- 10⁵: 0.8
- 10⁶: 0.8
- **IterDRAG**:
- 10²: -1.2
- 10³: -0.1
- 10⁴: 0.9
- 10⁵: 1.2
- 10⁶: 1.2
- **Optimal Config**:
- Constant: 1.0 across all x-values
## Comparative Analysis
1. **Performance Gaps**:
- RAG: 0.5 vs Optimal (1.0) = 0.5 unit deficit
- DRAG: 0.8 vs Optimal (1.0) = 0.2 unit deficit
- IterDRAG: 1.2 vs Optimal (1.0) = 0.2 unit surplus
2. **Scalability**:
- All models show logarithmic improvement patterns
- IterDRAG demonstrates fastest convergence (10³ to 10⁵)
- RAG shows slowest improvement rate
3. **Optimal Thresholds**:
- RAG: Reaches 50% of Optimal at 10⁴
- DRAG: Reaches 80% of Optimal at 10⁴
- IterDRAG: Exceeds Optimal at 10⁵
## Technical Notes
- All charts use logarithmic x-axis scaling for context length
- Normalized performance values suggest relative efficiency metrics
- Dashed lines represent theoretical optimal baselines
- Convergence points indicate model maturity thresholds