## Chart Type: Receiver Operating Characteristic (ROC) Curves
### Overview
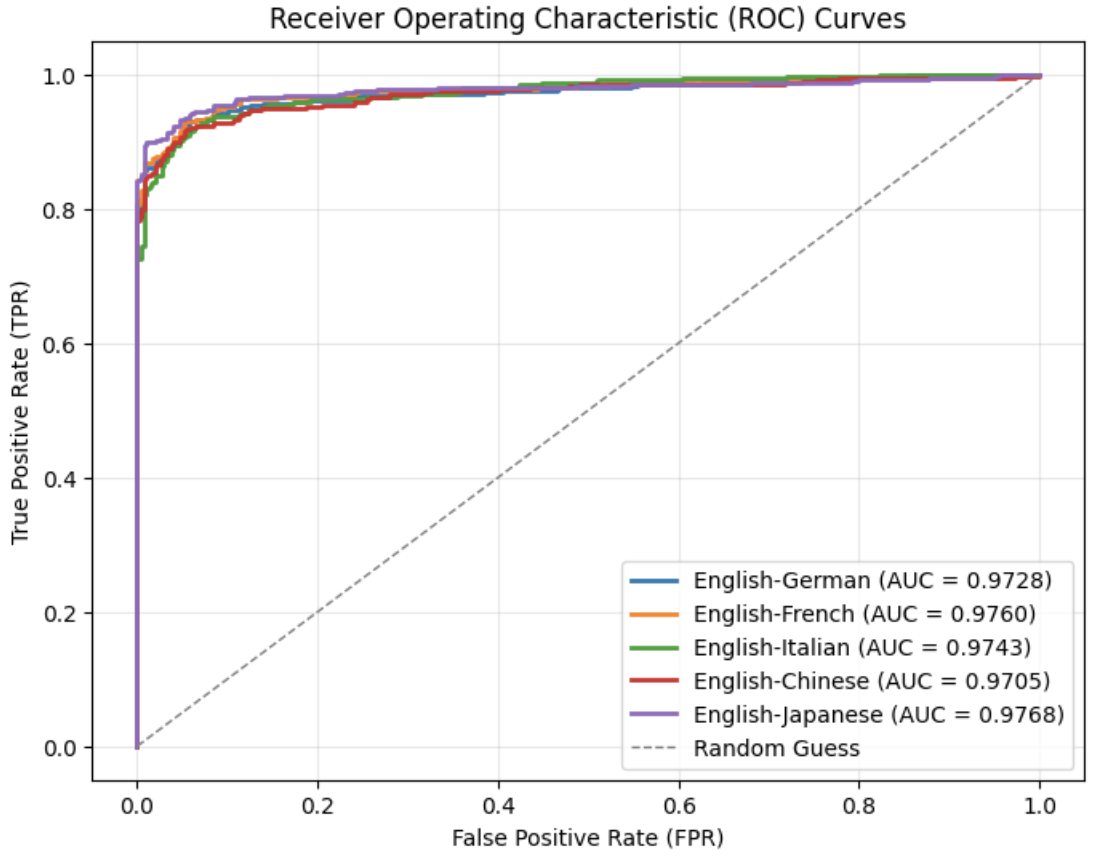
The image presents Receiver Operating Characteristic (ROC) curves for different language pairs, specifically English to German, French, Italian, Chinese, and Japanese. It also includes a "Random Guess" line for comparison. The ROC curves plot the True Positive Rate (TPR) against the False Positive Rate (FPR). The Area Under the Curve (AUC) is provided for each language pair, indicating the performance of the classification model.
### Components/Axes
* **Title:** Receiver Operating Characteristic (ROC) Curves
* **X-axis:** False Positive Rate (FPR), ranging from 0.0 to 1.0 in increments of 0.2.
* **Y-axis:** True Positive Rate (TPR), ranging from 0.0 to 1.0 in increments of 0.2.
* **Legend:** Located in the bottom-right corner.
* English-German (AUC = 0.9728) - Blue line
* English-French (AUC = 0.9760) - Orange line
* English-Italian (AUC = 0.9743) - Green line
* English-Chinese (AUC = 0.9705) - Red line
* English-Japanese (AUC = 0.9768) - Purple line
* Random Guess - Dashed gray line
### Detailed Analysis
* **English-German (AUC = 0.9728):** The blue line starts at (0,0.78) then rises sharply to approximately (0.02, 0.92), then continues to rise more gradually, reaching approximately 0.98 at FPR = 0.2, and then plateaus near TPR = 1.0.
* **English-French (AUC = 0.9760):** The orange line starts at (0,0.85) then rises sharply to approximately (0.02, 0.94), then continues to rise more gradually, reaching approximately 0.98 at FPR = 0.2, and then plateaus near TPR = 1.0.
* **English-Italian (AUC = 0.9743):** The green line starts at (0,0.72) then rises sharply to approximately (0.02, 0.90), then continues to rise more gradually, reaching approximately 0.97 at FPR = 0.2, and then plateaus near TPR = 1.0.
* **English-Chinese (AUC = 0.9705):** The red line starts at (0,0.85) then rises sharply to approximately (0.02, 0.92), then continues to rise more gradually, reaching approximately 0.96 at FPR = 0.2, and then plateaus near TPR = 1.0.
* **English-Japanese (AUC = 0.9768):** The purple line starts at (0,0.0) then rises sharply to approximately (0.02, 0.95), then continues to rise more gradually, reaching approximately 0.98 at FPR = 0.2, and then plateaus near TPR = 1.0.
* **Random Guess:** The dashed gray line represents a random classifier, with TPR equal to FPR. It starts at (0,0) and ends at (1,1).
### Key Observations
* All language pairs perform significantly better than random guessing, as indicated by their AUC values being much greater than 0.5.
* English-Japanese has the highest AUC (0.9768), closely followed by English-French (0.9760).
* English-Chinese has the lowest AUC (0.9705) among the language pairs.
* The ROC curves for all language pairs are very similar, indicating comparable performance in translation quality.
* The curves rise sharply at low FPR values, indicating a high true positive rate even with a low false positive rate.
### Interpretation
The ROC curves demonstrate the performance of machine translation models for different language pairs with English as the source language. The AUC values suggest that all models perform well, with English-Japanese and English-French showing slightly better performance than the others. The steep initial rise in the curves indicates that the models are effective at correctly identifying positive instances (accurate translations) while minimizing false positives (incorrect translations). The "Random Guess" line serves as a baseline, highlighting the significant improvement achieved by the translation models. The similarity in the curves suggests that the models have comparable performance across different target languages. The models are very good at distinguishing between correct and incorrect translations.