## Chart: Receiver Operating Characteristic (ROC) Curves
### Overview
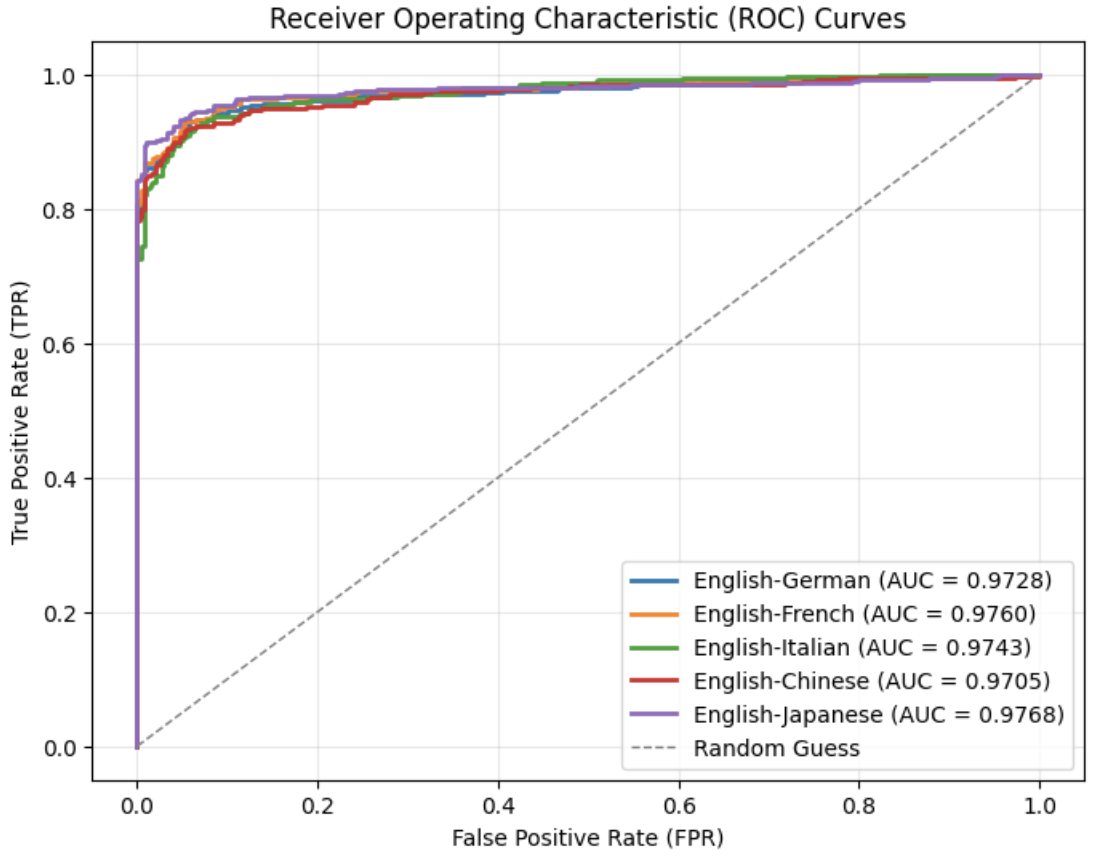
The image displays a Receiver Operating Characteristic (ROC) curve chart comparing the performance of a classification model across multiple language pairs. The chart plots True Positive Rate (TPR) against False Positive Rate (FPR) for different language combinations, with a reference line for random guessing.
### Components/Axes
- **X-axis**: False Positive Rate (FPR) ranging from 0.0 to 1.0
- **Y-axis**: True Positive Rate (TPR) ranging from 0.0 to 1.0
- **Legend**: Located in the bottom-right corner, listing:
- English-German (blue, AUC = 0.9728)
- English-French (orange, AUC = 0.9760)
- English-Italian (green, AUC = 0.9743)
- English-Chinese (red, AUC = 0.9705)
- English-Japanese (purple, AUC = 0.9768)
- Random Guess (dashed gray line)
### Detailed Analysis
- **English-Japanese (purple)**: Highest AUC (0.9768), showing the steepest curve with minimal FPR before reaching high TPR.
- **English-French (orange)**: Second-highest AUC (0.9760), closely following English-Japanese.
- **English-Italian (green)**: AUC 0.9743, slightly lower than English-French but still above random.
- **English-German (blue)**: AUC 0.9728, with a slightly flatter curve compared to others.
- **English-Chinese (red)**: Lowest AUC (0.9705) among language pairs, with a more gradual slope.
- **Random Guess (dashed gray)**: Diagonal line from (0,0) to (1,1), serving as a baseline.
### Key Observations
1. All language pairs outperform random guessing (dashed line).
2. English-Japanese and English-French show nearly identical performance (AUC ~0.976).
3. English-Chinese has the lowest AUC (0.9705), indicating relatively poorer model performance.
4. Curves converge near (1,1), suggesting high overall accuracy across all pairs.
### Interpretation
The chart demonstrates that the classification model performs exceptionally well across all tested language pairs, with AUC values consistently above 0.97. The English-Japanese and English-French combinations show the highest discriminative power, while English-Chinese lags slightly behind. The proximity of curves suggests minimal variation in model effectiveness between language pairs, though English-Chinese may require further optimization. The high AUC values (>0.97) indicate strong predictive capability, though the slight differences in performance could reflect language-specific challenges (e.g., syntactic complexity, data scarcity) or model biases.