## Histogram: Price and Duration Distributions of o1-Mini
### Overview
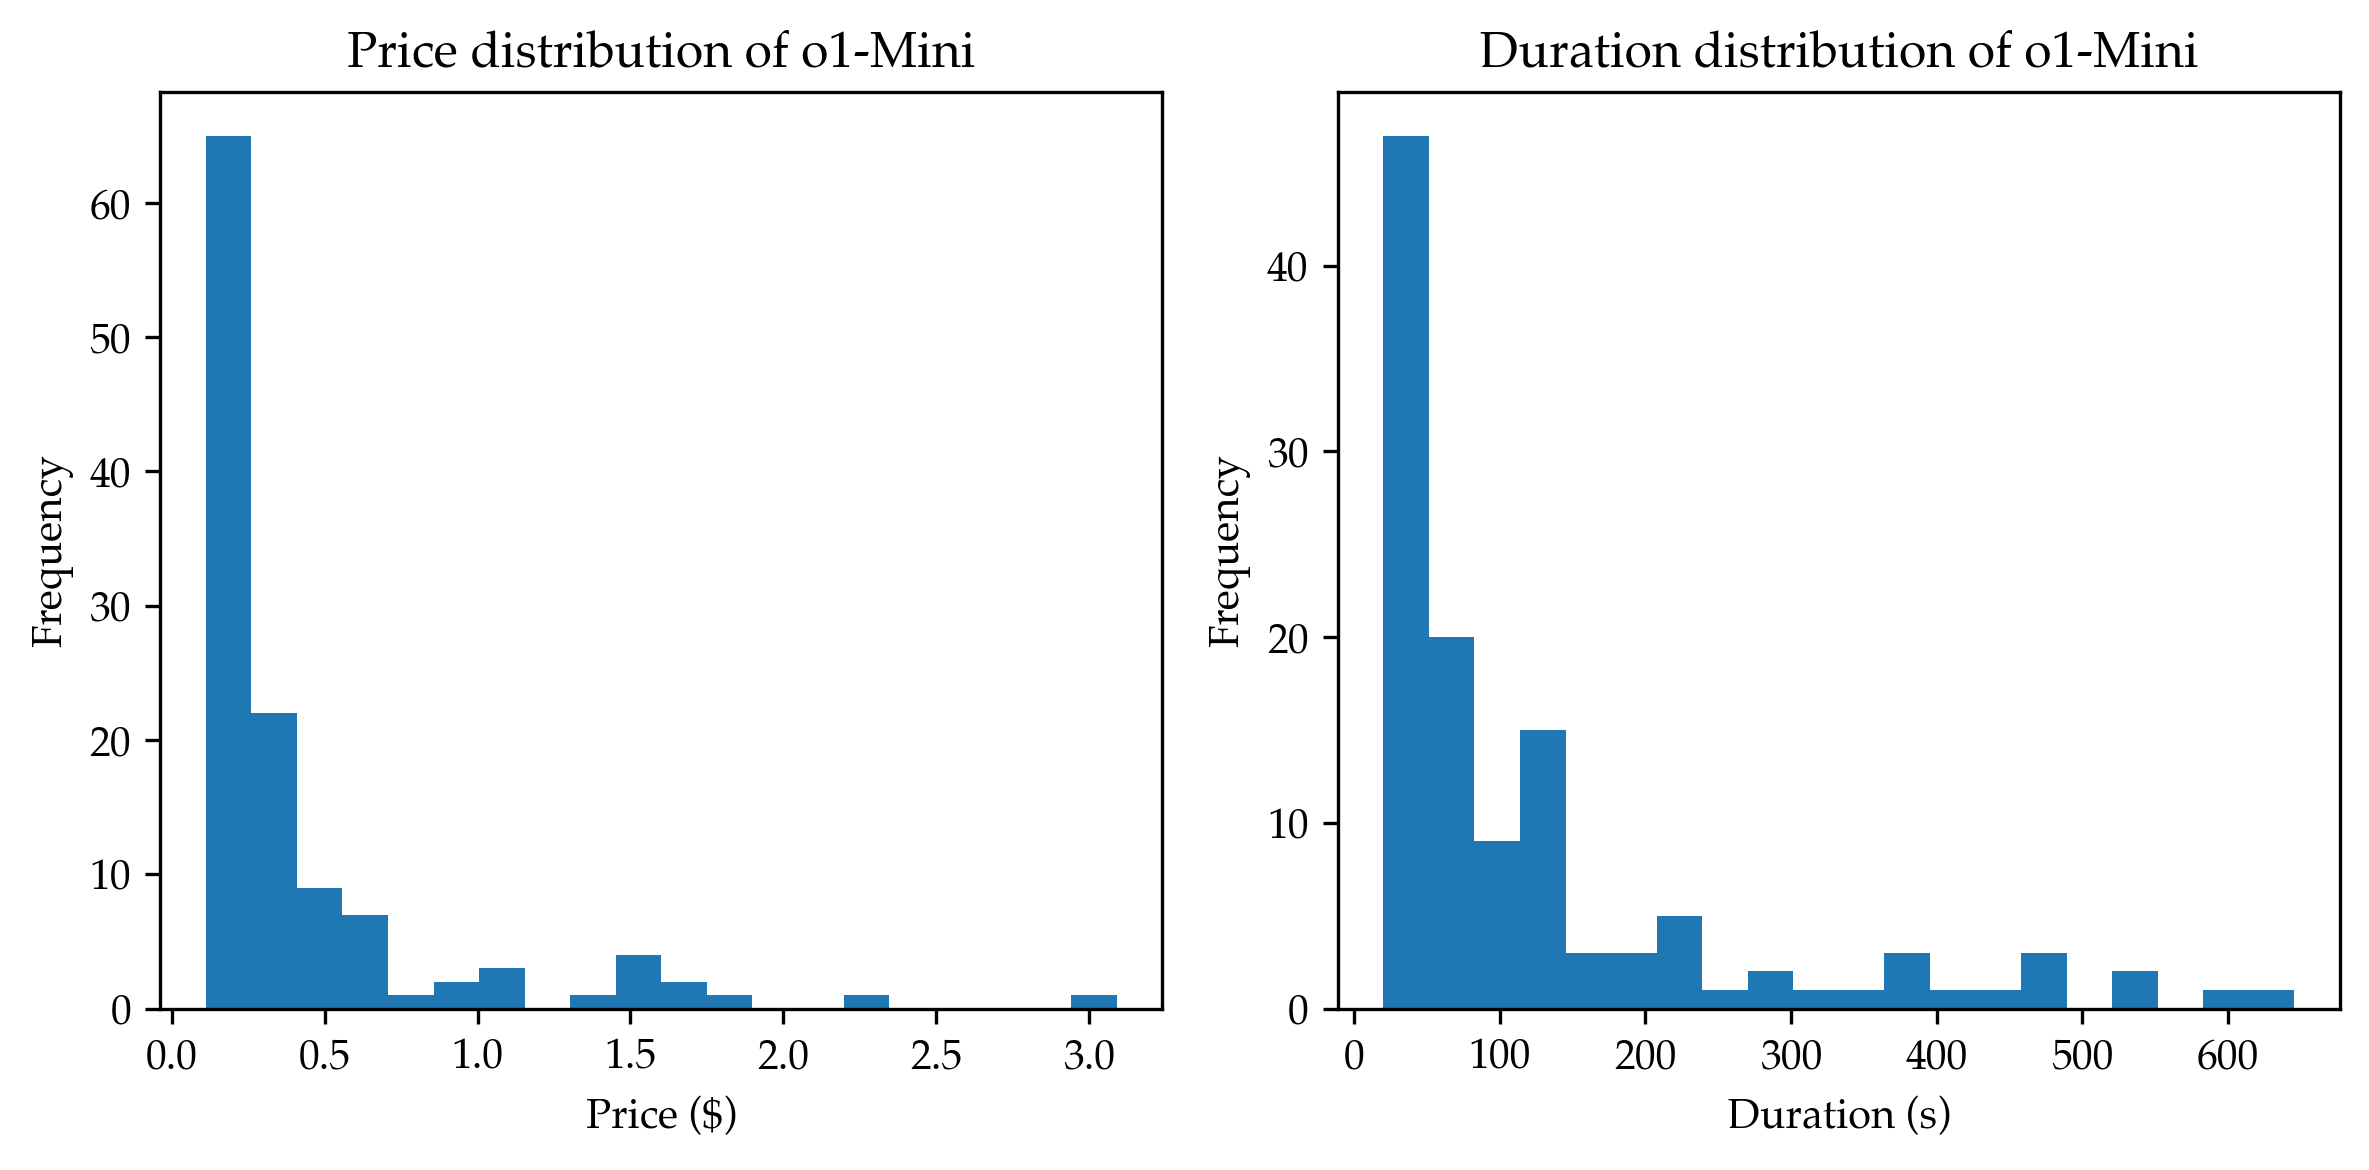
The image presents two histograms side-by-side. The left histogram displays the price distribution of "o1-Mini," while the right histogram shows the duration distribution of "o1-Mini." Both histograms use frequency on the y-axis and price (in dollars) or duration (in seconds) on the x-axis.
### Components/Axes
**Left Histogram: Price Distribution**
* **Title:** Price distribution of o1-Mini
* **X-axis:** Price ($)
* Scale: 0.0 to 3.0, with increments of 0.5
* **Y-axis:** Frequency
* Scale: 0 to 60, with increments of 10
* **Bars:** Blue
**Right Histogram: Duration Distribution**
* **Title:** Duration distribution of o1-Mini
* **X-axis:** Duration (s)
* Scale: 0 to 600, with increments of 100
* **Y-axis:** Frequency
* Scale: 0 to 40, with increments of 10
* **Bars:** Blue
### Detailed Analysis
**Left Histogram: Price Distribution**
* **Trend:** The frequency decreases as the price increases. Most of the data points are clustered at the lower end of the price range.
* **Data Points (Approximate):**
* 0.0 - 0.25: Frequency ~ 65
* 0.25 - 0.5: Frequency ~ 22
* 0.5 - 0.75: Frequency ~ 8
* 0.75 - 1.0: Frequency ~ 7
* 1.0 - 1.25: Frequency ~ 2
* 1.25 - 1.5: Frequency ~ 3
* 1.5 - 1.75: Frequency ~ 4
* 1.75 - 2.0: Frequency ~ 2
* 2.0 - 2.25: Frequency ~ 1
* 2.25 - 2.5: Frequency ~ 0
* 2.5 - 2.75: Frequency ~ 0
* 2.75 - 3.0: Frequency ~ 2
**Right Histogram: Duration Distribution**
* **Trend:** The frequency decreases as the duration increases. Most of the data points are clustered at the lower end of the duration range.
* **Data Points (Approximate):**
* 0 - 50: Frequency ~ 46
* 50 - 100: Frequency ~ 20
* 100 - 150: Frequency ~ 15
* 150 - 200: Frequency ~ 3
* 200 - 250: Frequency ~ 5
* 250 - 300: Frequency ~ 2
* 300 - 350: Frequency ~ 2
* 350 - 400: Frequency ~ 1
* 400 - 450: Frequency ~ 3
* 450 - 500: Frequency ~ 2
* 500 - 550: Frequency ~ 1
* 550 - 600: Frequency ~ 2
### Key Observations
* Both distributions are heavily skewed to the right, indicating that most instances of "o1-Mini" have low prices and short durations.
* The price distribution has a higher maximum frequency (around 65) compared to the duration distribution (around 46).
* The price ranges from 0 to 3 dollars, while the duration ranges from 0 to 600 seconds.
### Interpretation
The histograms suggest that "o1-Mini" is typically inexpensive and of short duration. The right skew in both distributions indicates that while there are some instances of higher prices and longer durations, they are relatively rare. This could imply that "o1-Mini" represents a service or product that is generally offered at a low cost and for a short period. The relationship between the two histograms is that they both describe characteristics of the same entity ("o1-Mini"), providing insights into its typical cost and usage time.