## Histograms: Price and Duration Distribution of o1-Mini
### Overview
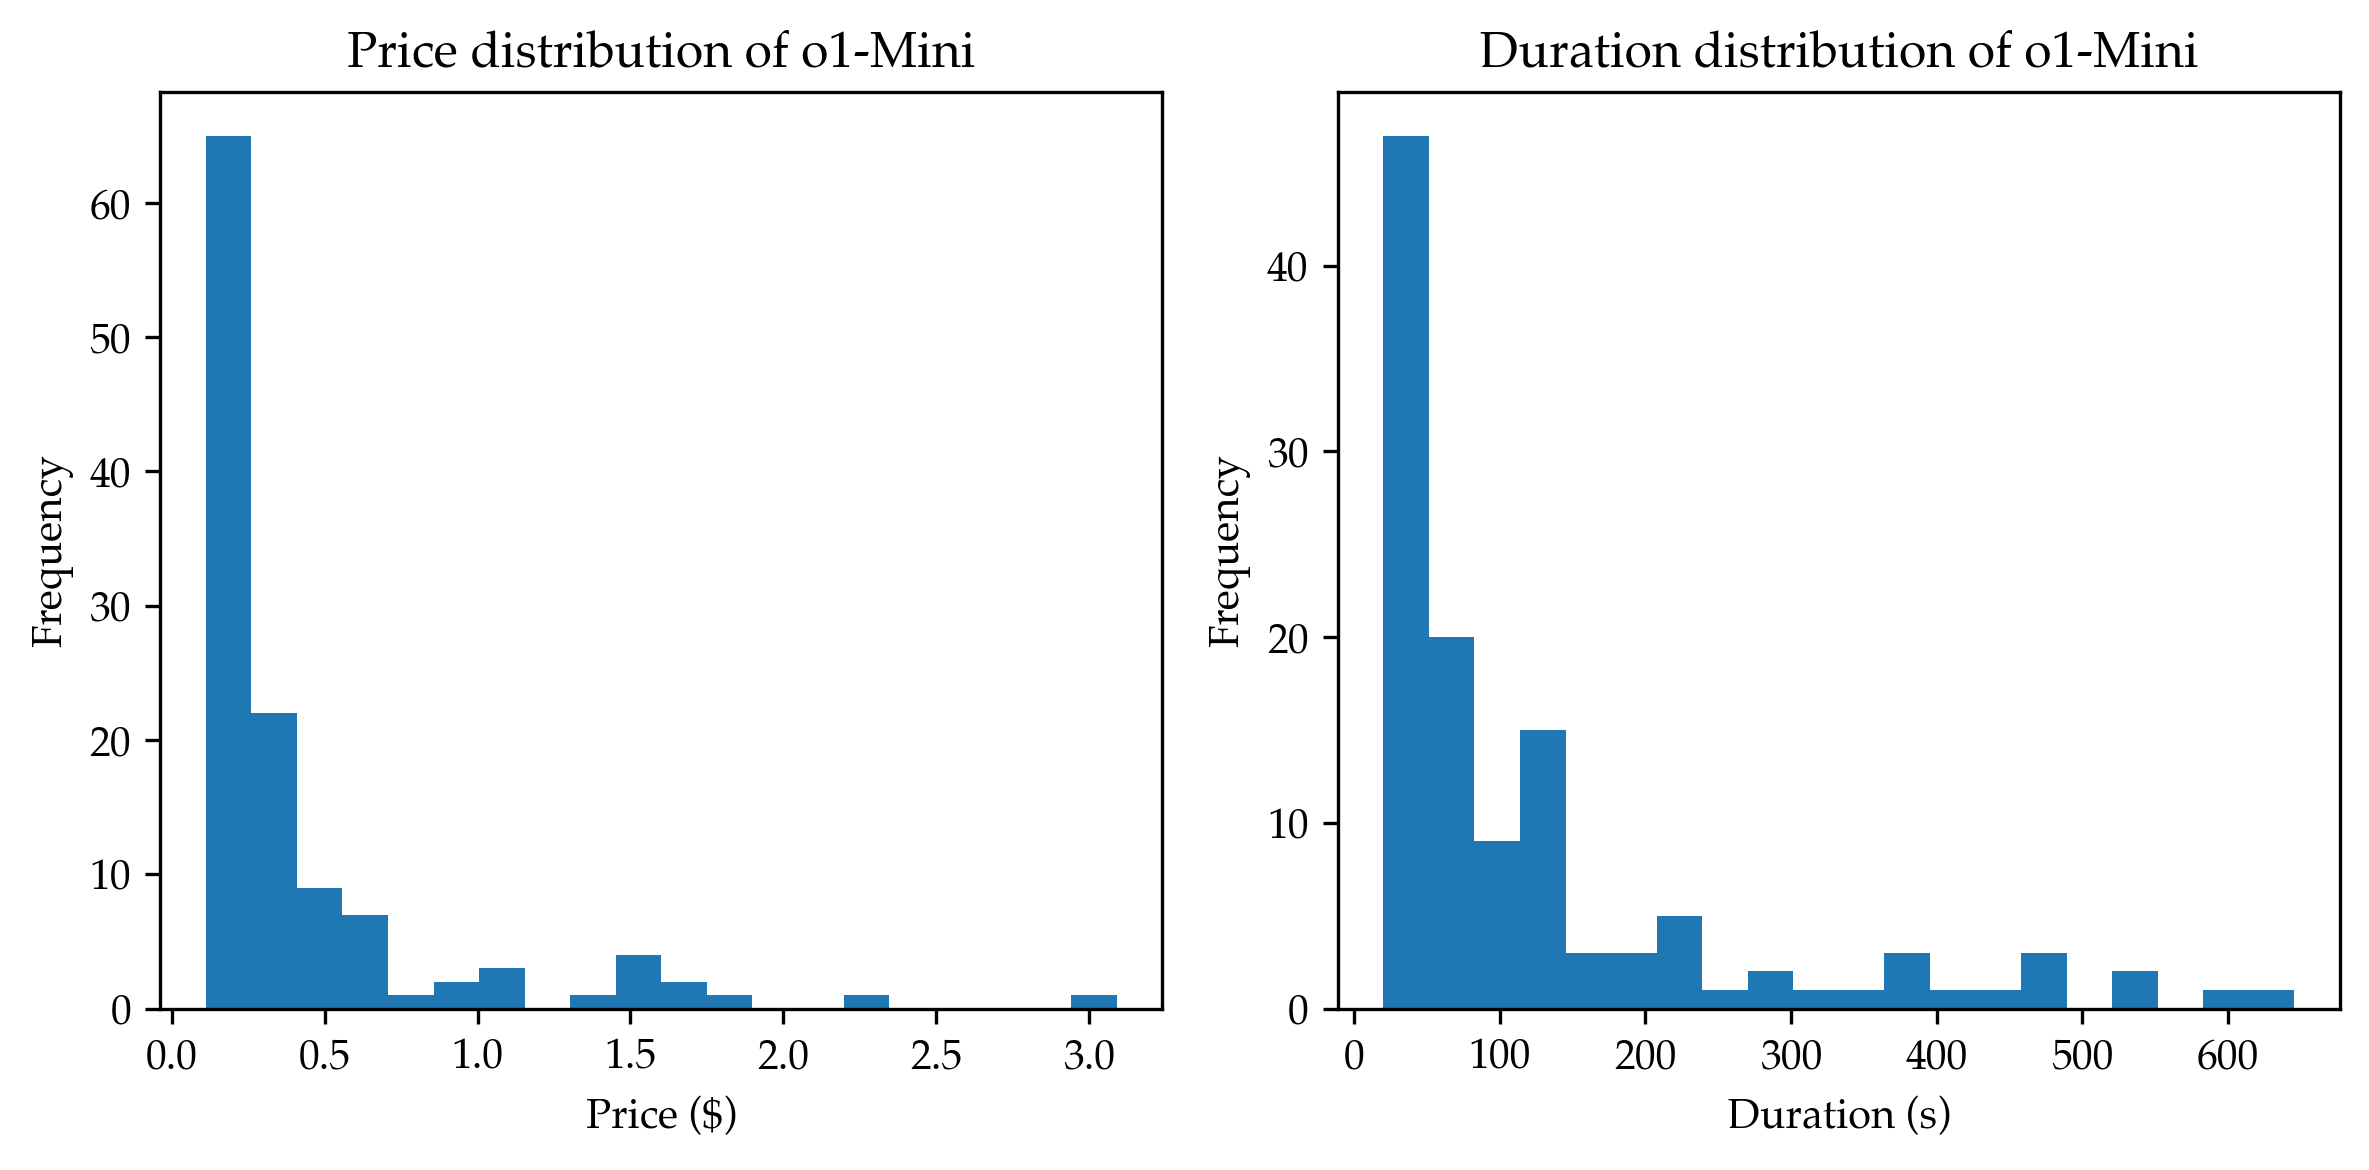
The image presents two histograms displayed side-by-side. The left histogram shows the price distribution of "o1-Mini", while the right histogram shows its duration distribution. Both histograms use the same blue color for the bars.
### Components/Axes
**Left Histogram (Price Distribution):**
* **Title:** "Price distribution of o1-Mini" (top-center)
* **X-axis Label:** "Price ($)" (bottom-center)
* **Y-axis Label:** "Frequency" (left-center)
* **X-axis Scale:** Ranges from approximately 0.0 to 3.0, with tick marks at 0.0, 0.5, 1.0, 1.5, 2.0, 2.5, and 3.0.
* **Y-axis Scale:** Ranges from approximately 0 to 60, with tick marks at 0, 10, 20, 30, 40, 50, and 60.
**Right Histogram (Duration Distribution):**
* **Title:** "Duration distribution of o1-Mini" (top-center)
* **X-axis Label:** "Duration (s)" (bottom-center)
* **Y-axis Label:** "Frequency" (left-center)
* **X-axis Scale:** Ranges from approximately 0 to 600, with tick marks at 0, 100, 200, 300, 400, 500, and 600.
* **Y-axis Scale:** Ranges from approximately 0 to 60, with tick marks at 0, 10, 20, 30, 40, 50, and 60.
### Detailed Analysis or Content Details
**Left Histogram (Price Distribution):**
The distribution is heavily skewed to the right. The highest frequency occurs at a price near 0.0 ($). The frequency decreases rapidly as the price increases.
* Approximate frequency at Price = 0.0 ($): 60
* Approximate frequency at Price = 0.2 ($): 23
* Approximate frequency at Price = 0.4 ($): 12
* Approximate frequency at Price = 0.6 ($): 5
* Approximate frequency at Price = 0.8 ($): 3
* Approximate frequency at Price = 1.0 ($): 2
* Approximate frequency at Price = 1.2 ($): 1
* Approximate frequency at Price = 1.4 ($): 1
* Approximate frequency at Price = 1.6 ($): 0
* Approximate frequency at Price = 1.8 ($): 0
* Approximate frequency at Price = 2.0 ($): 0
* Approximate frequency at Price = 2.2 ($): 0
* Approximate frequency at Price = 2.4 ($): 0
* Approximate frequency at Price = 2.6 ($): 0
* Approximate frequency at Price = 2.8 ($): 0
**Right Histogram (Duration Distribution):**
The distribution is also skewed, but less so than the price distribution. The highest frequency occurs at a duration near 0 seconds. The frequency decreases as the duration increases, with a smaller peak around 150-200 seconds.
* Approximate frequency at Duration = 0 (s): 52
* Approximate frequency at Duration = 50 (s): 20
* Approximate frequency at Duration = 100 (s): 15
* Approximate frequency at Duration = 150 (s): 12
* Approximate frequency at Duration = 200 (s): 7
* Approximate frequency at Duration = 250 (s): 4
* Approximate frequency at Duration = 300 (s): 2
* Approximate frequency at Duration = 350 (s): 1
* Approximate frequency at Duration = 400 (s): 1
* Approximate frequency at Duration = 450 (s): 0
* Approximate frequency at Duration = 500 (s): 1
* Approximate frequency at Duration = 550 (s): 0
* Approximate frequency at Duration = 600 (s): 0
### Key Observations
* The price of "o1-Mini" is heavily concentrated near 0.0 ($), with very few instances of higher prices.
* The duration of "o1-Mini" is also concentrated near 0 seconds, but there is a secondary peak around 150-200 seconds, suggesting a significant number of instances with durations in that range.
* Both distributions are not normally distributed.
### Interpretation
The data suggests that "o1-Mini" is typically very inexpensive and has a short duration. The right skew in the price distribution indicates that while most instances are cheap, there are a few outliers with higher prices. The duration distribution suggests that most instances are very short, but a notable portion have durations between 150 and 200 seconds. This could represent different types of usage or events associated with "o1-Mini". The presence of a secondary peak in the duration distribution warrants further investigation to understand the nature of these longer-duration instances. The data could be used to understand the cost and time investment associated with using "o1-Mini".