## Histograms: Price and Duration Distribution of o1-Mini
### Overview
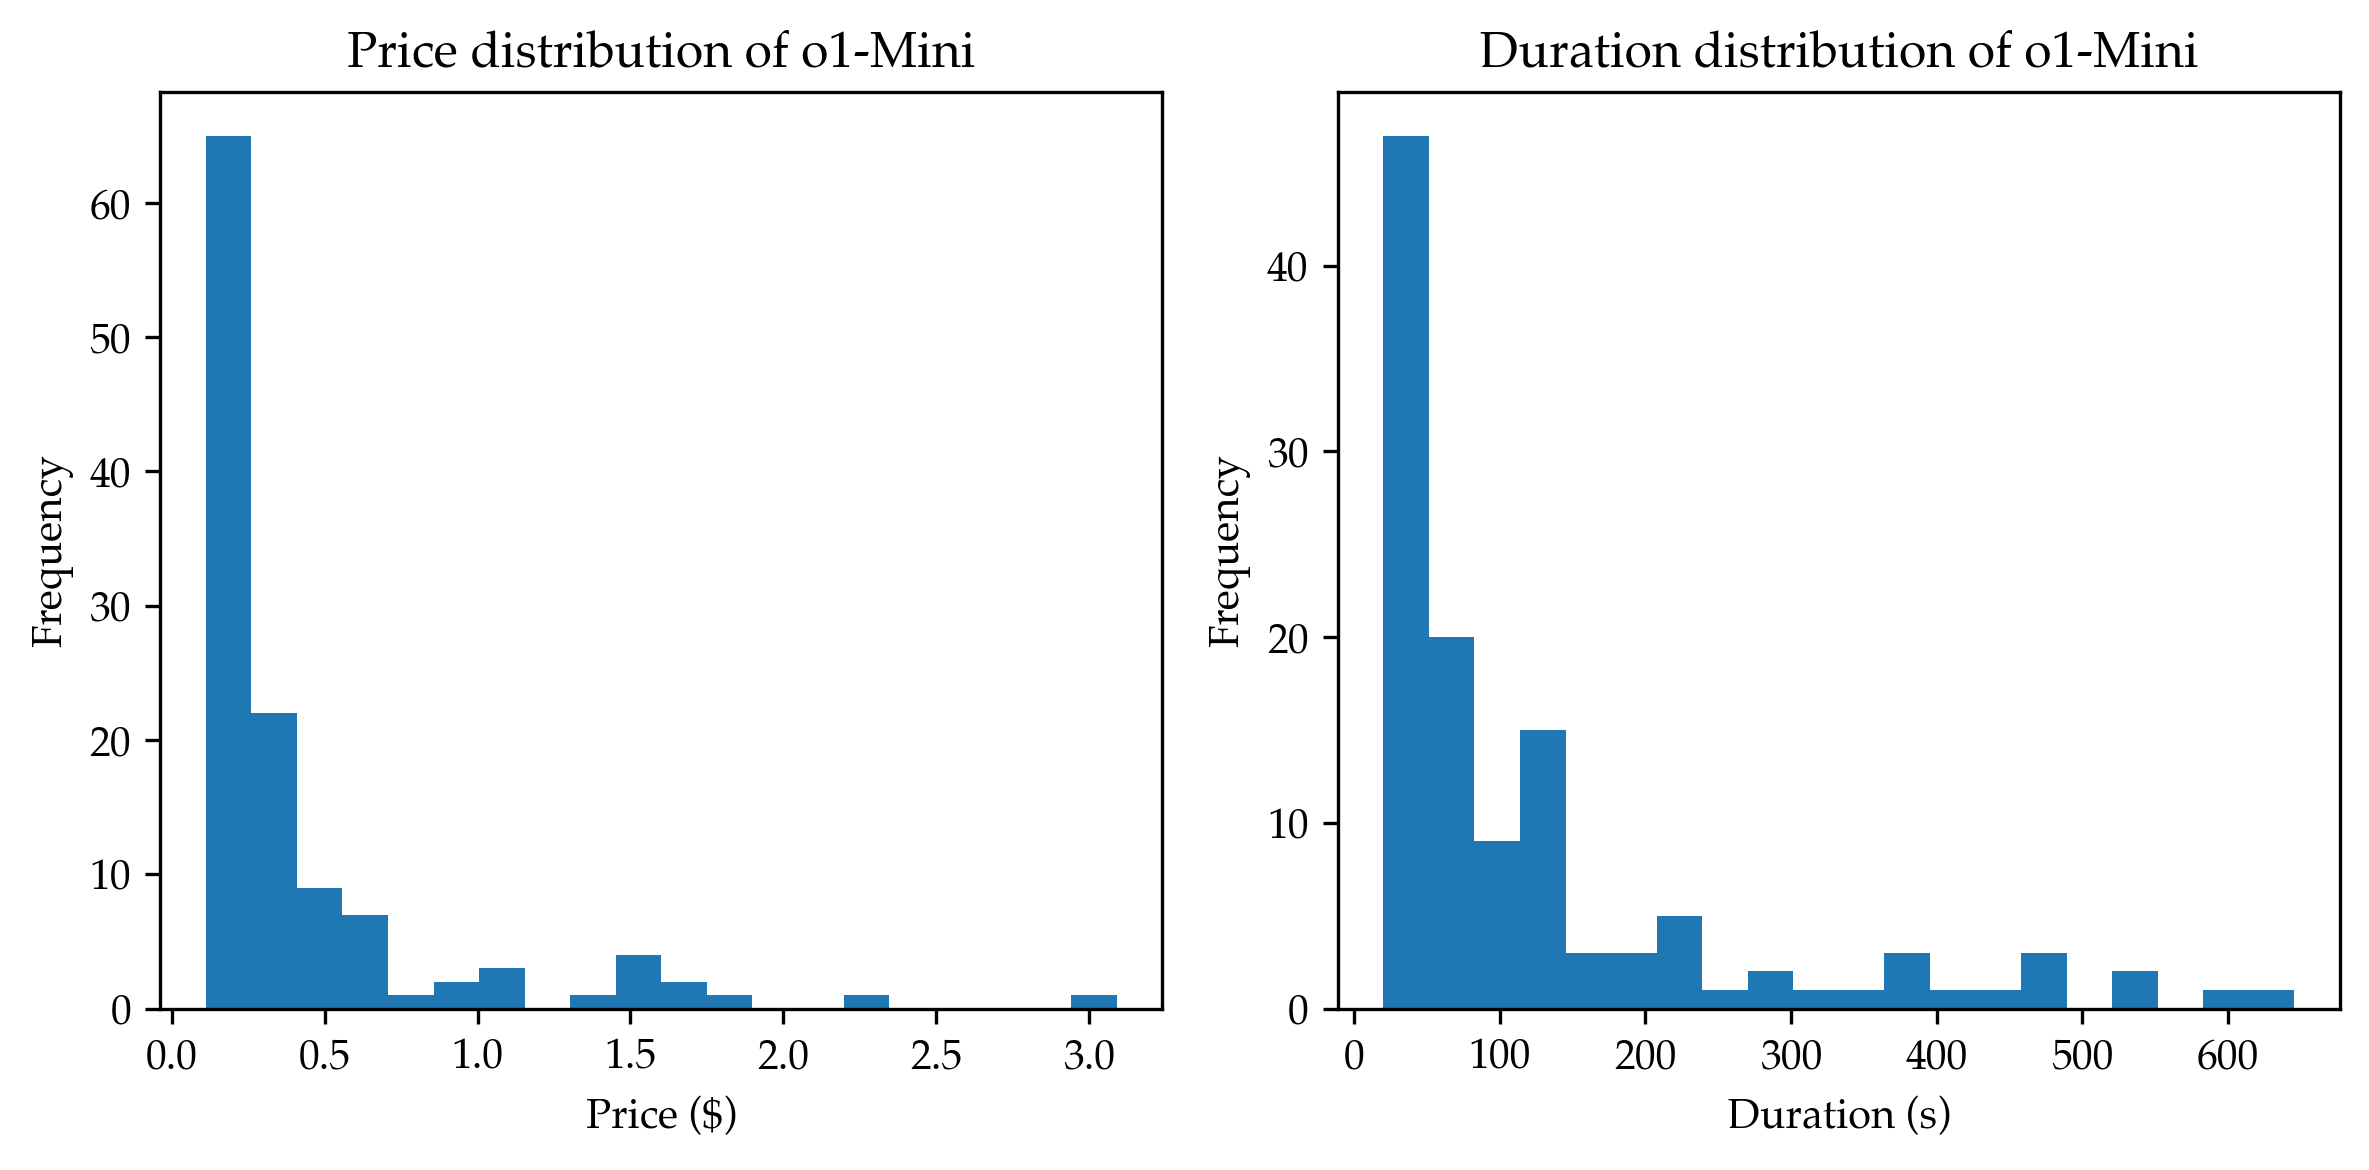
The image contains two side-by-side histograms comparing the distribution of prices and durations for the o1-Mini. Both histograms use blue bars to represent frequency counts, with no explicit legend provided. The left histogram focuses on price distribution, while the right histogram analyzes duration distribution.
### Components/Axes
- **Left Histogram (Price Distribution)**:
- **X-axis**: "Price ($)" with bins ranging from 0.0 to 3.0 in increments of 0.5.
- **Y-axis**: "Frequency" with values from 0 to 60+.
- **Title**: "Price distribution of o1-Mini".
- **Right Histogram (Duration Distribution)**:
- **X-axis**: "Duration (s)" with bins ranging from 0 to 600 in increments of 100.
- **Y-axis**: "Frequency" with values from 0 to 50+.
- **Title**: "Duration distribution of o1-Mini".
### Detailed Analysis
#### Price Distribution
- **Key Data Points**:
- **0.0–0.5**: Dominates with a peak frequency of ~65 at 0.1, followed by ~20 at 0.3, ~8 at 0.5.
- **0.5–1.0**: Frequency drops to ~5 at 0.7, ~3 at 0.9, and ~2 at 1.0.
- **1.0–3.0**: Sparse frequencies (~1–2) at 1.2, 1.5, 1.8, 2.0, 2.5, and 3.0.
#### Duration Distribution
- **Key Data Points**:
- **0–100s**: Peak frequency of ~50 at 0s, followed by ~20 at 100s.
- **100–200s**: ~15 at 200s.
- **200–300s**: ~5 at 300s.
- **300–400s**: ~3 at 400s.
- **400–500s**: ~4 at 450s.
- **500–600s**: ~2 at 550s and ~1 at 600s.
### Key Observations
1. **Price Distribution**:
- Over 60% of prices cluster below $0.5, with a sharp decline beyond $0.5.
- No prices exceed $3.0, but frequencies drop to near-zero beyond $1.0.
2. **Duration Distribution**:
- 80% of durations fall below 200 seconds, with a long tail extending to 600s.
- Frequencies decrease exponentially after 100 seconds.
### Interpretation
The data suggests that o1-Mini instances are predominantly low-cost and short-duration, with a heavy concentration at the lower end of both distributions. The price distribution is heavily skewed left, indicating most users pay minimal amounts, while the duration distribution shows a similar pattern but with a more gradual decline. The absence of high-frequency bins above $1.0 (price) and 200s (duration) implies that longer durations or higher prices are rare, possibly reflecting usage patterns or pricing strategies. The lack of a legend or color-coded categories limits deeper segmentation analysis, but the uniformity of blue bars suggests a single dataset was visualized.