## Image Comparison: 3DGS Variants
### Overview
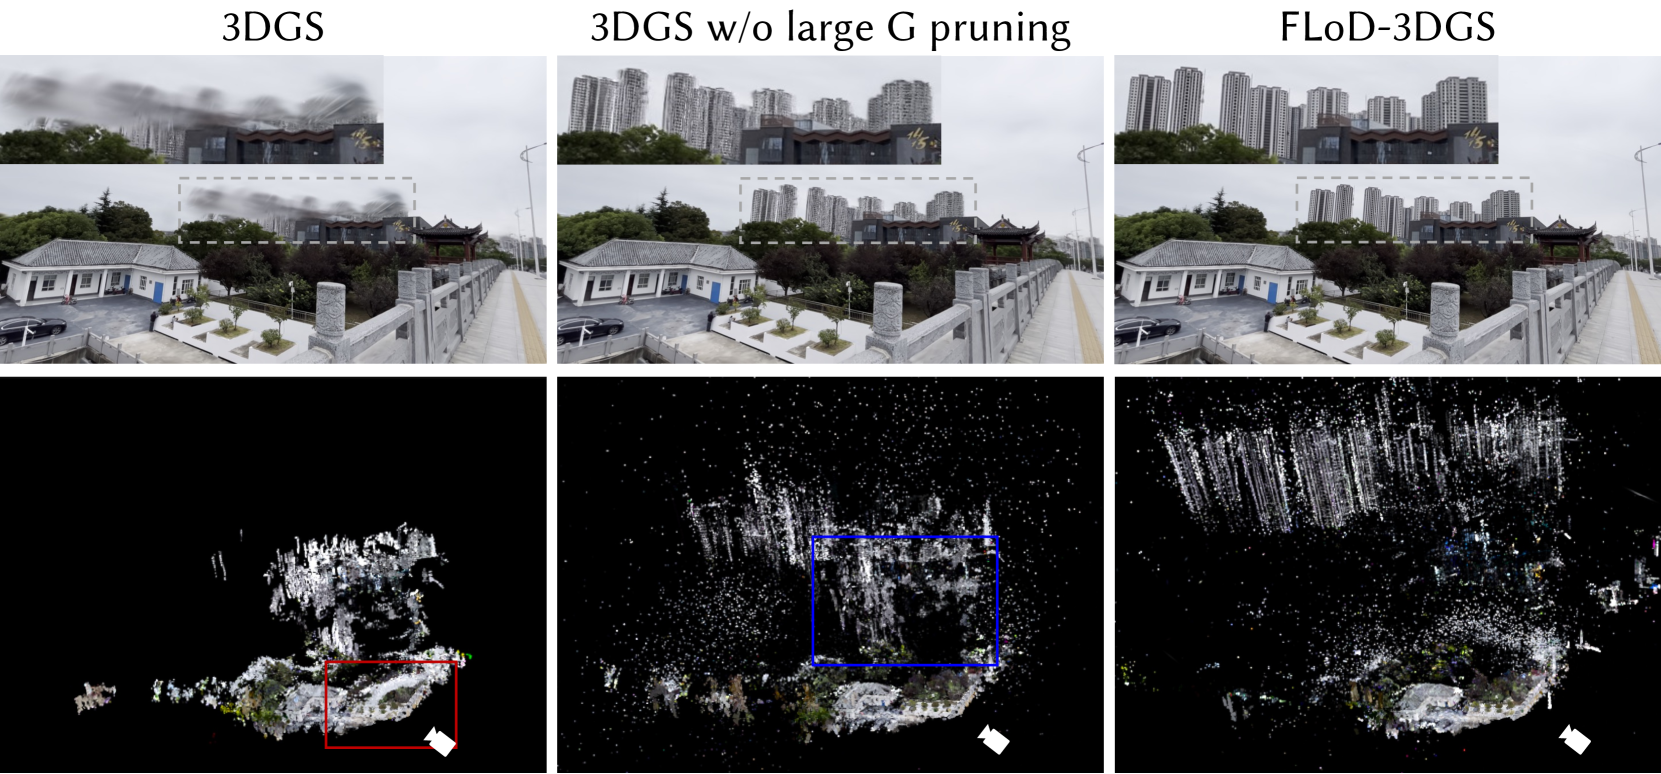
The image presents a visual comparison of three different 3D Gaussian Splatting (3DGS) methods for scene reconstruction. The methods are: 3DGS, 3DGS without large G pruning, and FLoD-3DGS. Each method is represented by two images: a rendered view of the scene and a point cloud representation. The rendered views show a scene with buildings, trees, and a bridge. The point cloud representations illustrate the density and structure of the reconstructed scene.
### Components/Axes
* **Titles (Top Row):**
* 3DGS (left)
* 3DGS w/o large G pruning (center)
* FLoD-3DGS (right)
* **Images:** Each method has two images associated with it. The top image is a rendered view of the scene, and the bottom image is a point cloud representation.
* **Bounding Boxes:** Red and blue bounding boxes are present in the point cloud representations, highlighting specific regions of interest. The red box is in the 3DGS point cloud, and the blue box is in the 3DGS w/o large G pruning point cloud.
* **Camera Icon:** A white camera icon is present in the bottom right corner of each point cloud representation, indicating the viewpoint.
* **Scene Elements:** The scene includes buildings, trees, a bridge, and other environmental features.
### Detailed Analysis or Content Details
**3DGS (Left Column):**
* **Rendered View:** The rendered view appears blurry, especially in the background where the buildings are located. A dashed gray box highlights a region of the background.
* **Point Cloud:** The point cloud is relatively sparse. A red bounding box surrounds a portion of the point cloud.
**3DGS w/o large G pruning (Center Column):**
* **Rendered View:** The rendered view is clearer than the 3DGS version, with more defined buildings in the background. A dashed gray box highlights a region of the background.
* **Point Cloud:** The point cloud is denser than the 3DGS version. A blue bounding box surrounds a portion of the point cloud.
**FLoD-3DGS (Right Column):**
* **Rendered View:** The rendered view is similar in clarity to the 3DGS w/o large G pruning version. A dashed gray box highlights a region of the background.
* **Point Cloud:** The point cloud appears to have a different structure than the other two, with more vertical lines.
### Key Observations
* The 3DGS method produces a blurrier rendered view compared to the other two methods.
* The point cloud density varies between the methods, with 3DGS w/o large G pruning having the densest point cloud.
* The FLoD-3DGS point cloud exhibits a distinct vertical line structure.
* The bounding boxes highlight different regions of interest in the point clouds.
### Interpretation
The image demonstrates the impact of different 3DGS techniques on scene reconstruction. The "3DGS w/o large G pruning" method seems to produce a clearer rendered view and a denser point cloud compared to the standard "3DGS" method. The "FLoD-3DGS" method introduces a different point cloud structure, potentially indicating a different approach to scene representation. The bounding boxes likely highlight areas where the differences between the methods are most pronounced, suggesting specific regions for further analysis. The blurriness in the original 3DGS suggests that pruning may be necessary for higher quality reconstructions.