## Pie Chart: Distribution of Reasoning Path Validity
### Overview
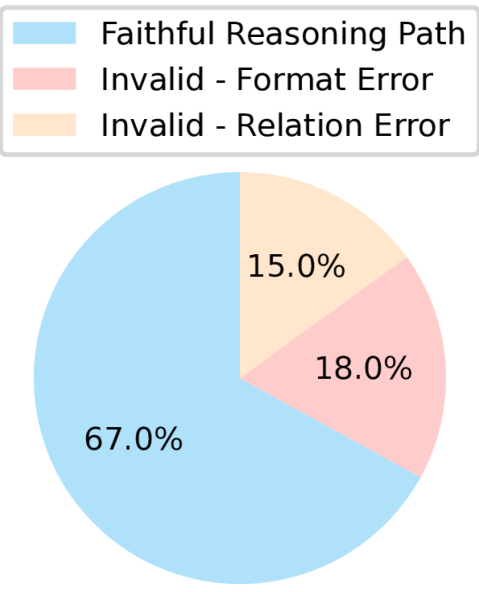
The image is a pie chart illustrating the distribution of reasoning path validity across three categories. The chart uses distinct colors to differentiate between valid and invalid paths, with percentages explicitly labeled for each segment.
### Components/Axes
- **Legend**: Positioned at the top-left of the chart, the legend maps colors to categories:
- **Blue**: Faithful Reasoning Path (67.0%)
- **Pink**: Invalid - Format Error (18.0%)
- **Light Orange**: Invalid - Relation Error (15.0%)
- **Chart Segments**:
- **Blue Segment**: Occupies the largest portion (67.0%), labeled "Faithful Reasoning Path."
- **Pink Segment**: Occupies 18.0%, labeled "Invalid - Format Error."
- **Light Orange Segment**: Occupies 15.0%, labeled "Invalid - Relation Error."
### Detailed Analysis
- **Faithful Reasoning Path (Blue)**: Dominates the chart at 67.0%, indicating the majority of reasoning paths are valid.
- **Invalid - Format Error (Pink)**: Accounts for 18.0%, representing errors in structural or syntactic formatting.
- **Invalid - Relation Error (Light Orange)**: Accounts for 15.0%, representing logical inconsistencies or relational errors.
### Key Observations
1. **Majority Validity**: 67.0% of reasoning paths are valid, suggesting robust overall performance.
2. **Invalid Paths**: Combined invalid paths (33.0%) highlight areas for improvement.
3. **Error Type Distribution**: Format errors (18.0%) are slightly more frequent than relation errors (15.0%), indicating potential prioritization of structural validation.
### Interpretation
The data suggests that while most reasoning paths are valid, a significant portion (33.0%) contains errors. The higher frequency of format errors (18.0%) compared to relation errors (15.0%) may imply that syntactic or structural validation mechanisms are more error-prone or less optimized than logical consistency checks. This could guide targeted improvements in error detection systems, such as refining format validation rules or enhancing relational logic analysis. The stark contrast between valid and invalid paths underscores the importance of addressing invalid cases to improve overall system reliability.