\n
## Pie Chart: Reasoning Path Validity Distribution
### Overview
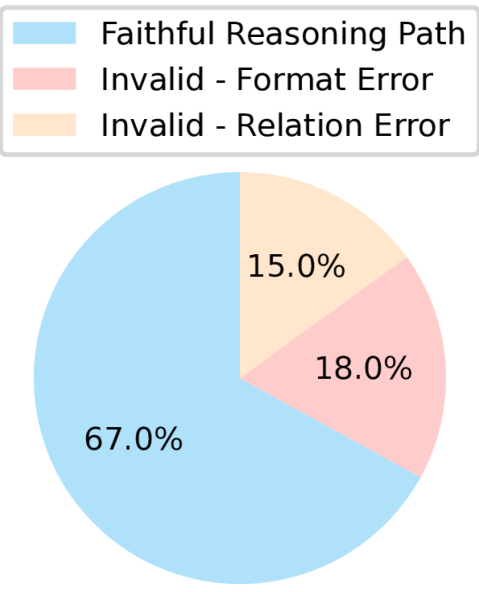
The image displays a pie chart illustrating the distribution of reasoning paths into three categories: one valid ("Faithful") and two types of invalid paths ("Format Error" and "Relation Error"). The chart is presented without an explicit title.
### Components/Axes
* **Chart Type:** Pie Chart.
* **Legend:** Located at the top of the image. It contains three entries with corresponding color swatches:
* Light Blue Square: `Faithful Reasoning Path`
* Pink Square: `Invalid - Format Error`
* Beige Square: `Invalid - Relation Error`
* **Data Segments:** The pie is divided into three segments, each labeled with a percentage value. The color of each segment corresponds directly to an entry in the legend.
* **Labels:** Percentage values are placed directly on their corresponding pie segments.
### Detailed Analysis
The chart presents the following data distribution:
1. **Faithful Reasoning Path (Light Blue):**
* **Visual Trend:** This is the dominant segment, occupying the majority of the pie chart (approximately two-thirds).
* **Data Point:** `67.0%`
* **Spatial Grounding:** This segment occupies the left and bottom portion of the pie, starting from the 12 o'clock position and sweeping counter-clockwise past the 6 o'clock position.
2. **Invalid - Format Error (Pink):**
* **Visual Trend:** This is the second-largest segment.
* **Data Point:** `18.0%`
* **Spatial Grounding:** This segment is located in the bottom-right quadrant of the pie, adjacent to the light blue segment.
3. **Invalid - Relation Error (Beige):**
* **Visual Trend:** This is the smallest segment.
* **Data Point:** `15.0%`
* **Spatial Grounding:** This segment is located in the top-right quadrant of the pie, adjacent to both the pink and light blue segments.
**Data Verification:** The sum of the percentages (67.0% + 18.0% + 15.0%) equals 100.0%, confirming the chart's internal consistency.
### Key Observations
* The vast majority (67.0%) of the analyzed reasoning paths are classified as "Faithful."
* Invalid paths account for a combined total of 33.0% (18.0% + 15.0%).
* Among the invalid paths, "Format Error" (18.0%) is slightly more prevalent than "Relation Error" (15.0%).
### Interpretation
This chart provides a quantitative breakdown of reasoning path quality, likely from an evaluation of an AI or logical system. The data suggests that while the system produces a correct or "faithful" output most of the time (two-thirds of cases), there is a significant one-third failure rate.
The distinction between error types is crucial for diagnostic purposes. The higher incidence of "Format Error" over "Relation Error" indicates that the system's primary weakness may lie in adhering to output structure or syntactic rules, rather than in understanding or applying logical relationships between concepts. This insight would direct improvement efforts toward better formatting training or post-processing checks, as opposed to a fundamental overhaul of the system's relational reasoning core. The chart effectively communicates that reliability is moderately high but has a clear, categorizable area for targeted enhancement.