## Diagram: Geometric Configurations with Diagonal and Vertical Lines
### Overview
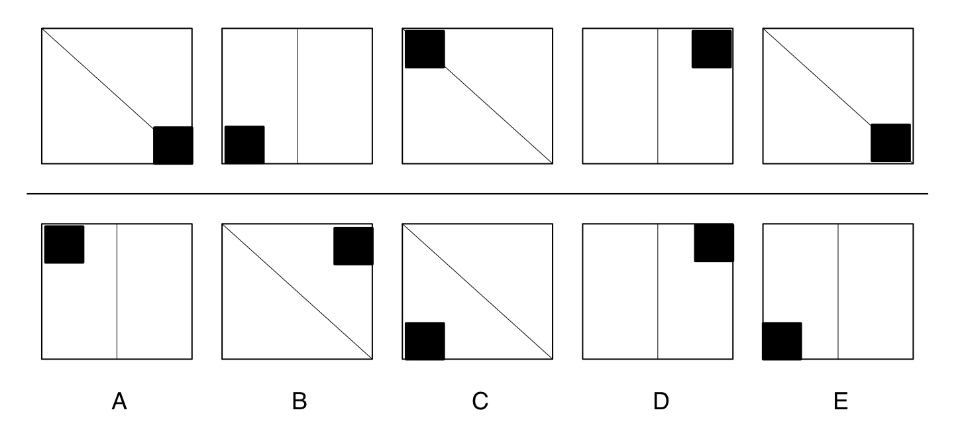
The image contains 10 labeled diagrams (A-E, repeated twice) arranged in two rows. Each diagram features a square divided by a diagonal line and a vertical line. The diagrams vary in the position of the vertical line (left, middle, right) and the orientation of the diagonal line (top-left to bottom-right or top-right to bottom-left). Black squares are positioned in specific corners relative to the lines.
### Components/Axes
- **Diagrams**: Labeled A to E (each repeated once).
- **Square**: Uniformly sized, divided into regions by:
- **Diagonal Line**: Connects two opposite corners (either top-left to bottom-right or top-right to bottom-left).
- **Vertical Line**: Splits the square into left and right regions; position varies (left, middle, right).
- **Black Square**: Placed in one corner of the larger square, overlapping with the intersection of the diagonal and vertical lines in some cases.
### Detailed Analysis
1. **Diagram A**:
- Vertical line on the left.
- Diagonal line from top-left to bottom-right.
- Black square in the bottom-left corner.
2. **Diagram B**:
- Vertical line in the middle.
- Diagonal line from top-left to bottom-right.
- Black square in the bottom-left corner.
3. **Diagram C**:
- Vertical line on the right.
- Diagonal line from top-left to bottom-right.
- Black square in the bottom-right corner.
4. **Diagram D**:
- Vertical line in the middle.
- Diagonal line from top-right to bottom-left.
- Black square in the top-right corner.
5. **Diagram E**:
- Vertical line on the left.
- Diagonal line from top-right to bottom-left.
- Black square in the top-left corner.
### Key Observations
- **Vertical Line Position**: Alternates between left, middle, and right across diagrams.
- **Diagonal Orientation**: Alternates between two orientations (top-left to bottom-right vs. top-right to bottom-left).
- **Black Square Placement**: Positioned to align with the intersection of the diagonal and vertical lines in most cases (e.g., bottom-left in A/B, bottom-right in C, top-right in D, top-left in E).
### Interpretation
The diagrams likely illustrate scenarios where the intersection of two decision boundaries (diagonal and vertical lines) determines an outcome (represented by the black square). For example:
- **Decision Trees**: The vertical line could represent a binary choice (left/right), while the diagonal line represents a secondary condition (e.g., cost vs. benefit).
- **Resource Allocation**: The black square might symbolize an optimal resource distribution point based on two constraints.
- **Game Theory**: The configurations could model strategies where players choose between options (vertical line) and outcomes (diagonal line).
No numerical data or trends are present. The diagrams emphasize spatial relationships and positional logic rather than quantitative analysis.