## Bar Chart: Task Performance
### Overview
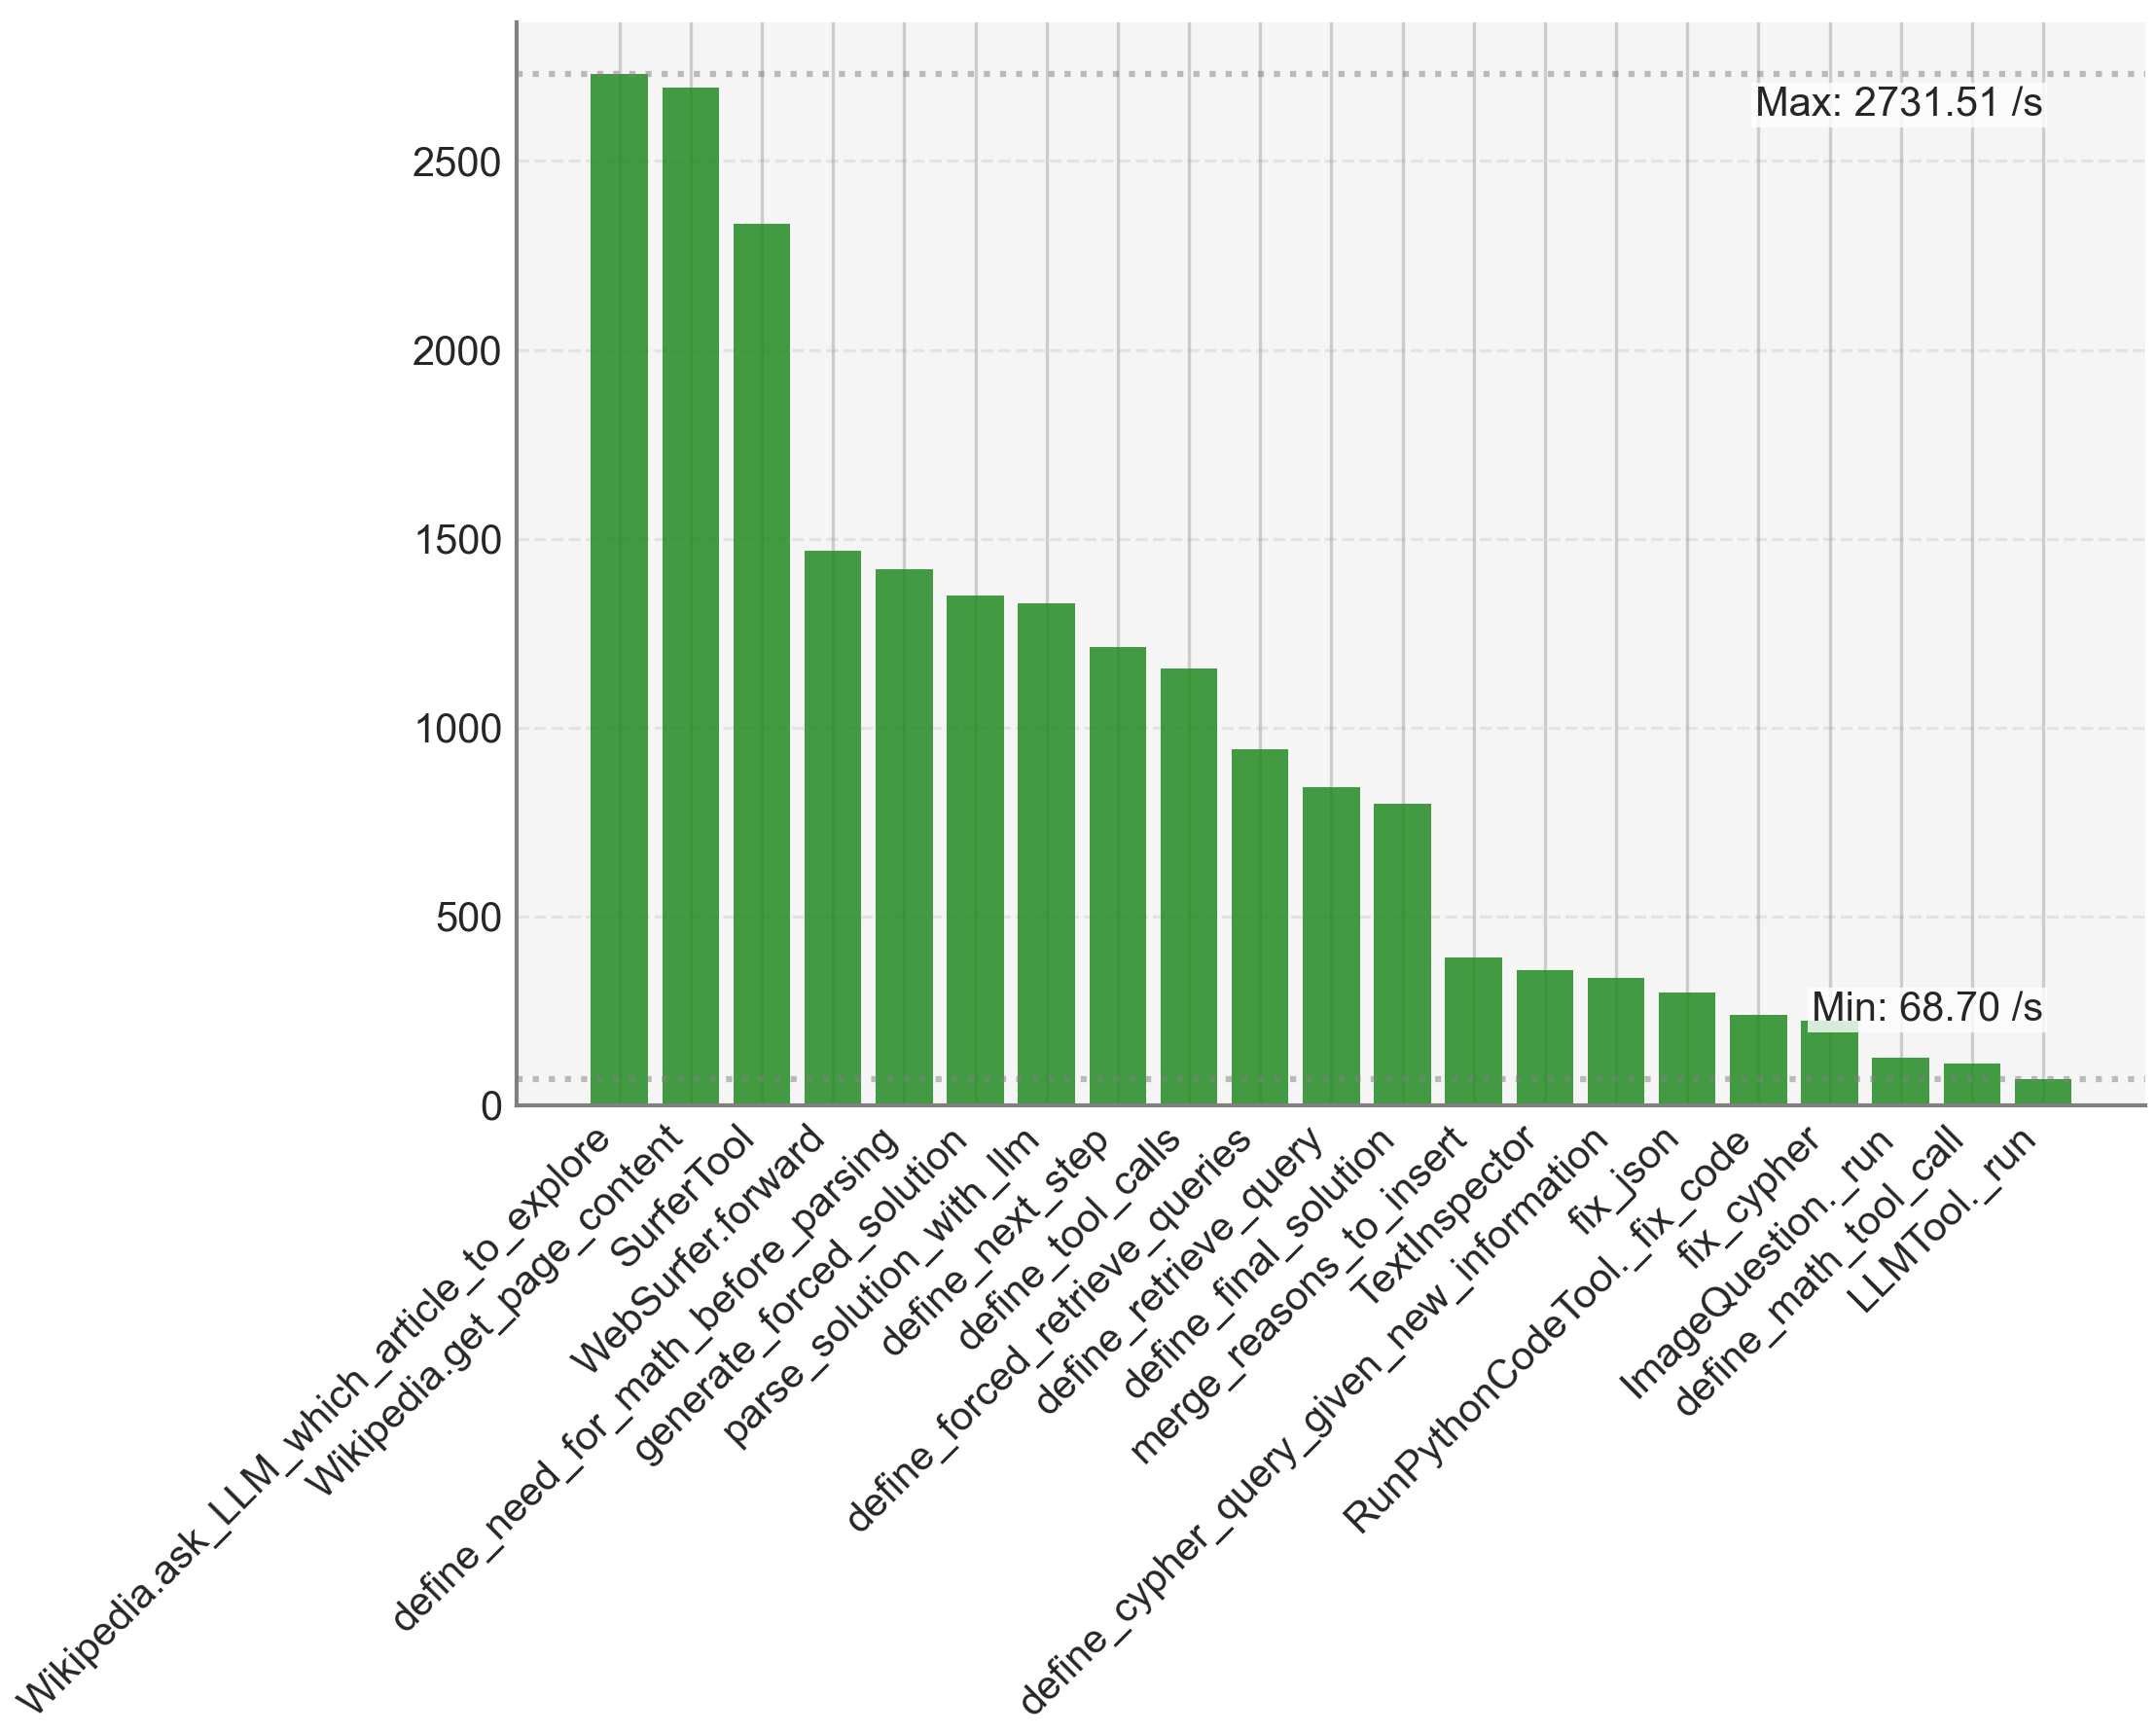
The image is a bar chart displaying the performance of various tasks, likely measured in operations per second. The chart shows a clear ranking of tasks from highest to lowest performance, with "Wikipedia.ask_LLM_which_article_to_explore" and "Wikipedia.get_page_content" showing the highest performance and "LLMTool._run" showing the lowest.
### Components/Axes
* **X-axis:** Categorical axis listing the names of the tasks. The labels are rotated for readability.
* Categories:
* Wikipedia.ask\_LLM\_which\_article\_to\_explore
* Wikipedia.get\_page\_content
* SurferTool
* WebSurfer.forward
* define\_need\_for\_math\_before\_parsing
* generate\_forced\_solution
* parse\_solution\_with\_llm
* define\_forced\_retrieve\_queries
* define\_next\_step
* define\_tool\_calls
* define\_retrieve\_queries
* define\_final\_solution
* merge\_reasons\_to\_insert
* define\_cypher\_query\_given\_new\_information
* TextInspector
* RunPythonCodeTool.\_fix\_code
* fix\_json
* fix\_cypher
* ImageQuestion.\_run
* define\_math\_tool\_call
* LLMTool.\_run
* **Y-axis:** Numerical axis representing the performance in operations per second (/s). The scale ranges from 0 to 2500, with gridlines at intervals of 500.
* Scale: 0, 500, 1000, 1500, 2000, 2500
* **Bars:** Green bars representing the performance value for each task.
* **Annotations:**
* "Max: 2731.51 /s" is located at the top-right of the chart.
* "Min: 68.70 /s" is located near the bottom-right of the chart.
### Detailed Analysis
The bar chart presents a clear performance ranking of the listed tasks. The performance values are as follows (approximate, based on bar height):
* **Wikipedia.ask\_LLM\_which\_article\_to\_explore:** \~2650 /s
* **Wikipedia.get\_page\_content:** \~2650 /s
* **SurferTool:** \~2350 /s
* **WebSurfer.forward:** \~1450 /s
* **define\_need\_for\_math\_before\_parsing:** \~1400 /s
* **generate\_forced\_solution:** \~1350 /s
* **parse\_solution\_with\_llm:** \~1300 /s
* **define\_forced\_retrieve\_queries:** \~1200 /s
* **define\_next\_step:** \~1150 /s
* **define\_tool\_calls:** \~900 /s
* **define\_retrieve\_queries:** \~800 /s
* **define\_final\_solution:** \~400 /s
* **merge\_reasons\_to\_insert:** \~350 /s
* **define\_cypher\_query\_given\_new\_information:** \~350 /s
* **TextInspector:** \~300 /s
* **RunPythonCodeTool.\_fix\_code:** \~300 /s
* **fix\_json:** \~250 /s
* **fix\_cypher:** \~200 /s
* **ImageQuestion.\_run:** \~100 /s
* **define\_math\_tool\_call:** \~75 /s
* **LLMTool.\_run:** \~70 /s
### Key Observations
* Two tasks, "Wikipedia.ask\_LLM\_which\_article\_to\_explore" and "Wikipedia.get\_page\_content", significantly outperform all other tasks.
* The performance drops off sharply after the first three tasks.
* The last few tasks ("fix\_cypher", "ImageQuestion.\_run", "define\_math\_tool\_call", and "LLMTool.\_run") have very low performance compared to the others.
* The maximum performance is 2731.51 /s, and the minimum is 68.70 /s.
### Interpretation
The chart indicates a wide range of performance across different tasks. The Wikipedia-related tasks are the most efficient, while tasks related to fixing code and running specific tools are significantly slower. This could be due to the complexity of the tasks, the efficiency of the algorithms used, or the resources required for each task. The large performance gap suggests that optimizing the slower tasks could lead to significant overall performance improvements. The tasks with the lowest performance may be bottlenecks in a larger system or workflow.