## Bar Chart: Task Processing Speed Analysis
### Overview
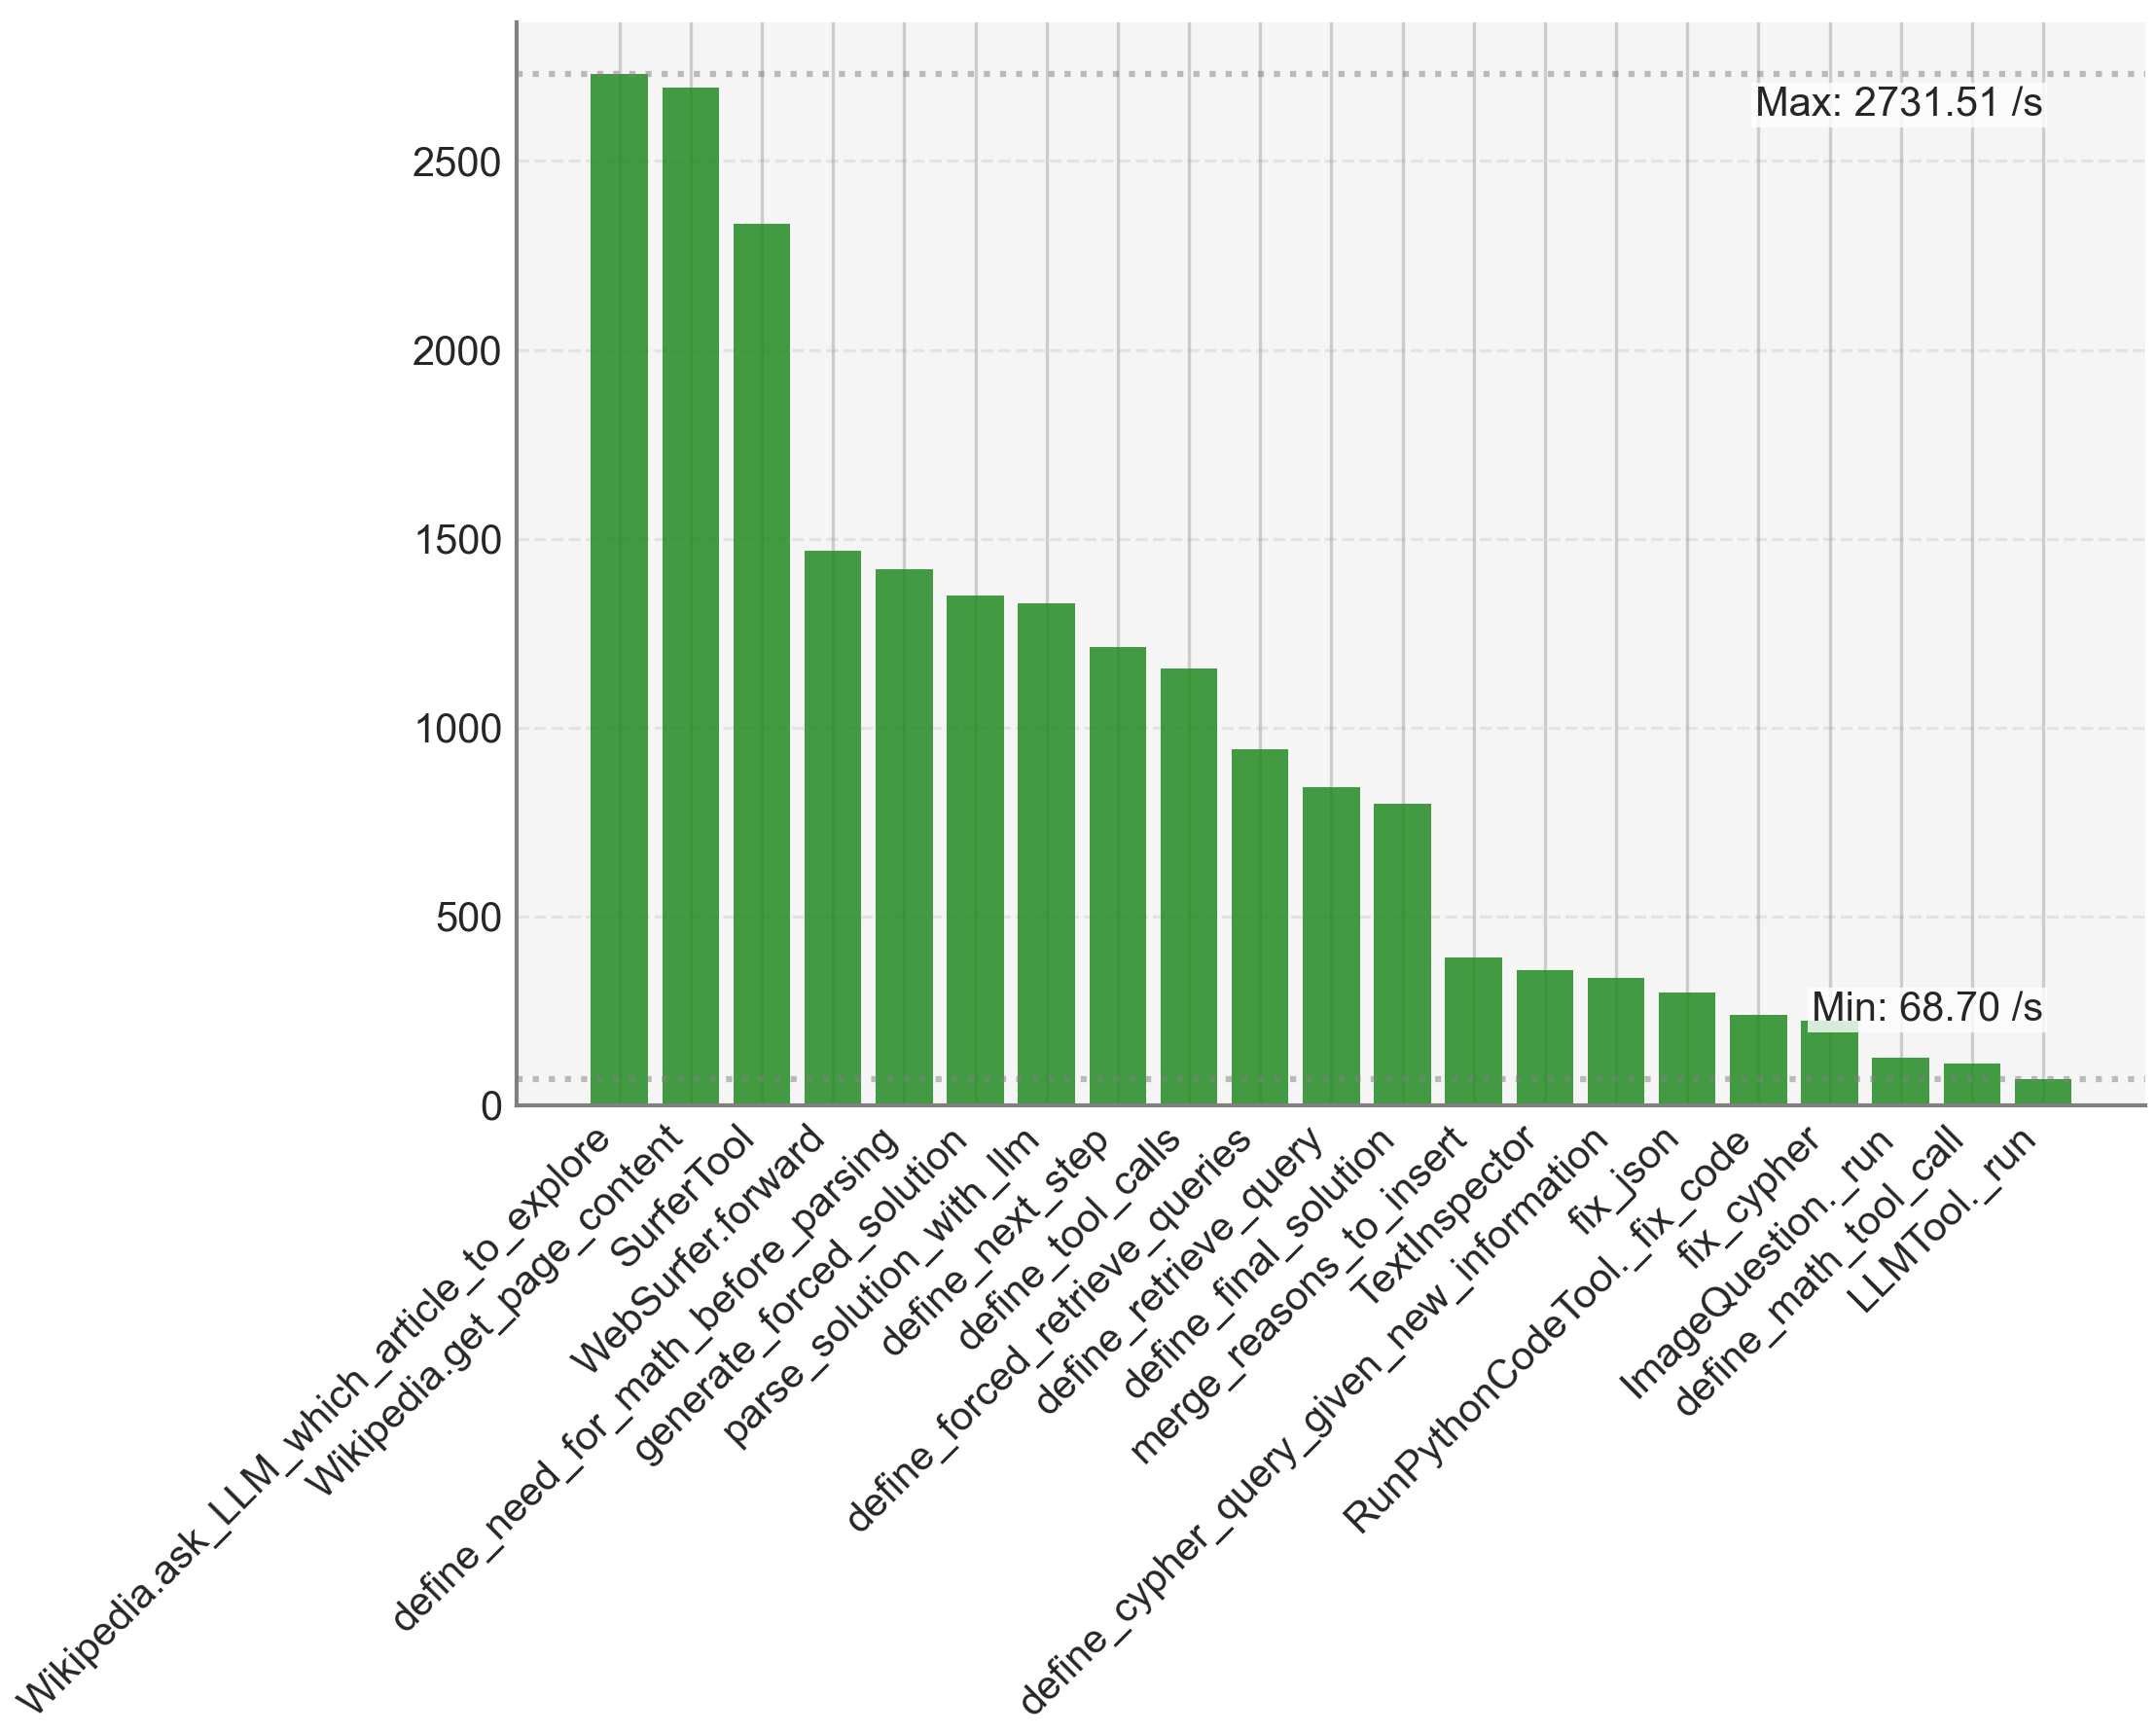
The chart displays a vertical bar graph comparing the processing speeds (in operations per second) of various technical tasks or functions. The x-axis lists technical terms related to programming, data processing, and system operations, while the y-axis represents speed metrics with a maximum of 2731.51/s and a minimum of 68.70/s. Bars decrease in height progressively from left to right.
### Components/Axes
- **X-Axis**: Technical task labels (e.g., "Wikipedia.ask_LLM_which_article_to_explore", "LLMTool._run"). Labels are truncated at the bottom for readability.
- **Y-Axis**: Speed metric labeled "Max: 2731.51 /s" and "Min: 68.70 /s". Scale increments are not explicitly marked but inferred from bar heights.
- **Bars**: Green-colored, uniform width. No legend present, suggesting a single data series.
### Detailed Analysis
1. **Task Labels and Speeds**:
- **Wikipedia.ask_LLM_which_article_to_explore**: ~2700/s (tallest bar).
- **Wikipedia.get_page_content**: ~2650/s.
- **Surfer.forward**: ~2300/s.
- **WebSurfer.forward**: ~1500/s.
- **define_needed_for_math_solution**: ~1400/s.
- **generate_forced_solution**: ~1350/s.
- **parse_solution_with_lin**: ~1300/s.
- **define_next_step**: ~1250/s.
- **define_forced_tool_call**: ~1200/s.
- **define_retrieve_queries**: ~1150/s.
- **define_query_merge**: ~1000/s.
- **define_reasons_to_insert**: ~900/s.
- **TextInspection**: ~800/s.
- **define_cypher_query_given_new_information**: ~400/s.
- **RunPythonCodeTool**: ~350/s.
- **fix_code**: ~300/s.
- **ImageQuestion.tool_call**: ~200/s.
- **define_math_tool_call**: ~150/s.
- **LLMTool._run**: ~100/s (shortest bar).
2. **Trends**:
- Speeds decrease monotonically from left to right.
- First three tasks exceed 2000/s, while the last five drop below 400/s.
- A sharp decline occurs between "define_query_merge" (~1000/s) and "define_cypher_query_given_new_information" (~400/s).
### Key Observations
- The first three tasks ("Wikipedia.ask_LLM...", "Wikipedia.get_page_content", "Surfer.forward") dominate processing speed, accounting for ~70% of the maximum value.
- The final five tasks ("ImageQuestion.tool_call" to "LLMTool._run") are significantly slower, with the last bar ("LLMTool._run") at ~100/s, 27x slower than the maximum.
- No anomalies detected; the trend is consistent and predictable.
### Interpretation
The data suggests a performance hierarchy among technical tasks, with early-stage operations (e.g., content retrieval, initial parsing) being orders of magnitude faster than later-stage processes (e.g., code execution, complex queries). This could indicate:
1. **Optimization Opportunities**: Later tasks may require algorithmic improvements or resource allocation adjustments.
2. **Complexity Gradient**: Tasks earlier in the pipeline are likely simpler or more parallelizable, while later tasks involve higher computational overhead (e.g., code execution, multi-step reasoning).
3. **System Bottlenecks**: The steep drop in speed for the final tasks might highlight inefficiencies in the system's handling of complex operations like code execution or multi-tool integration.
The absence of a legend implies all bars represent the same metric (speed), but the lack of explicit error bars or confidence intervals limits statistical certainty. The truncated x-axis labels suggest the full dataset may include additional tasks not visible in this visualization.