## Line Chart: Coefficient of Friction (C_f) vs. Normalized Distance (x/H)
### Overview
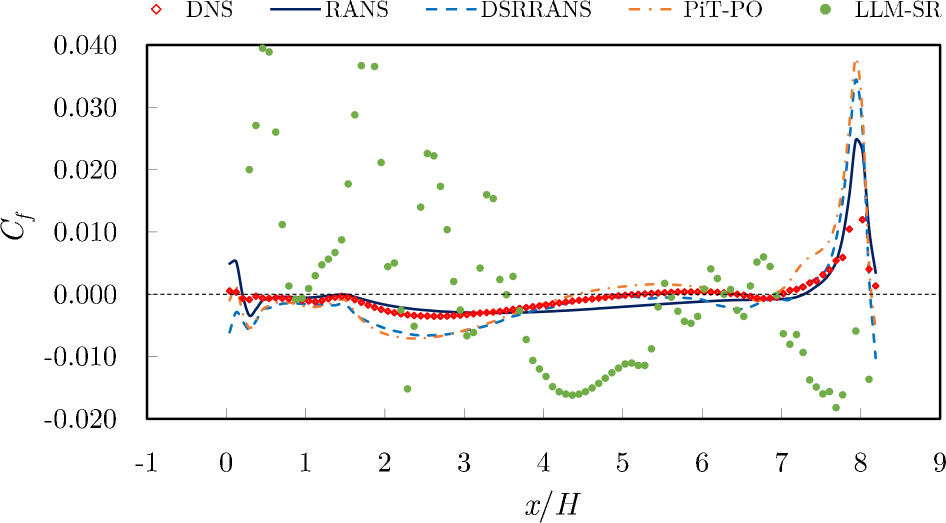
The chart compares the performance of multiple turbulence modeling approaches in predicting the coefficient of friction (C_f) across a normalized distance (x/H). Data is presented as both continuous lines (model predictions) and discrete points (empirical measurements or DNS validation). The graph spans x/H from -1 to 9 and C_f from -0.02 to 0.04.
### Components/Axes
- **X-axis**: Normalized distance (x/H), ranging from -1 to 9 in increments of 1.
- **Y-axis**: Coefficient of friction (C_f), ranging from -0.02 to 0.04 in increments of 0.01.
- **Legend**: Located in the top-right corner, with five entries:
- **DNS**: Red diamonds (empirical/validation data)
- **RANS**: Solid blue line (Reynolds-Averaged Navier-Stokes)
- **DSRRANS**: Dashed blue line (Delayed RANS)
- **PiT-PO**: Dashed orange line (Pressure-Impulse Turbulence Model)
- **LLM-SR**: Green dots (Large Eddy Simulation - Subgrid Resolution)
### Detailed Analysis
1. **DNS (Red Diamonds)**:
- Scattered data points clustered around the RANS line.
- Notable deviations at x/H ≈ 0.5 (C_f ≈ -0.005) and x/H ≈ 7.5 (C_f ≈ 0.015).
- Outliers at x/H ≈ -0.5 (C_f ≈ 0.035) and x/H ≈ 8.5 (C_f ≈ -0.015).
2. **RANS (Solid Blue Line)**:
- Baseline model with a smooth trend.
- Initial dip to C_f ≈ -0.01 at x/H = 0, recovering to C_f ≈ 0.005 by x/H = 1.
- Remains near C_f ≈ 0 until x/H = 8, where it spikes to C_f ≈ 0.035.
3. **DSRRANS (Dashed Blue Line)**:
- Mirrors RANS but with delayed response.
- Dip to C_f ≈ -0.008 at x/H = 0, rising to C_f ≈ 0.003 by x/H = 1.
- Spikes to C_f ≈ 0.03 at x/H = 8, slightly lower than RANS.
4. **PiT-PO (Dashed Orange Line)**:
- Similar trend to RANS but with higher variability.
- Peaks at C_f ≈ 0.032 at x/H = 8, with a broader rise.
5. **LLM-SR (Green Dots)**:
- Highly dispersed data points.
- Central cluster between C_f ≈ 0.005 and 0.025 (x/H = 2–7).
- Outliers at x/H ≈ -0.5 (C_f ≈ 0.03) and x/H ≈ 8.5 (C_f ≈ -0.01).
### Key Observations
- **Sharp Spike at x/H = 8**: All models predict a sudden increase in C_f, suggesting a critical flow transition (e.g., boundary layer separation or turbulence intensification).
- **DNS-RANS Agreement**: Empirical data (DNS) closely follows RANS predictions, validating its accuracy in this regime.
- **LLM-SR Variability**: Green dots show significant scatter, indicating potential limitations in subgrid-scale modeling or data resolution.
- **DSRRANS vs. RANS**: Delayed response in DSRRANS aligns with its design for transient flows but underperforms RANS in peak prediction.
### Interpretation
The graph demonstrates that RANS remains the most reliable model for steady-state predictions in this flow configuration, while DNS serves as a robust validation benchmark. The sharp C_f increase at x/H = 8 highlights a critical flow feature (e.g., shockwave or separation point) that all models capture, albeit with varying accuracy. LLM-SR’s inconsistency suggests challenges in resolving small-scale turbulence, possibly due to insufficient grid resolution or model assumptions. The DSRRANS and PiT-PO lines indicate that modifications to standard RANS (e.g., delayed effects or pressure-impulse mechanisms) improve transient behavior but require refinement for peak accuracy. The outliers in DNS and LLM-SR data may reflect experimental noise or unmodeled physical phenomena.