## Pie Charts: Reasoning Skills and Capabilities
### Overview
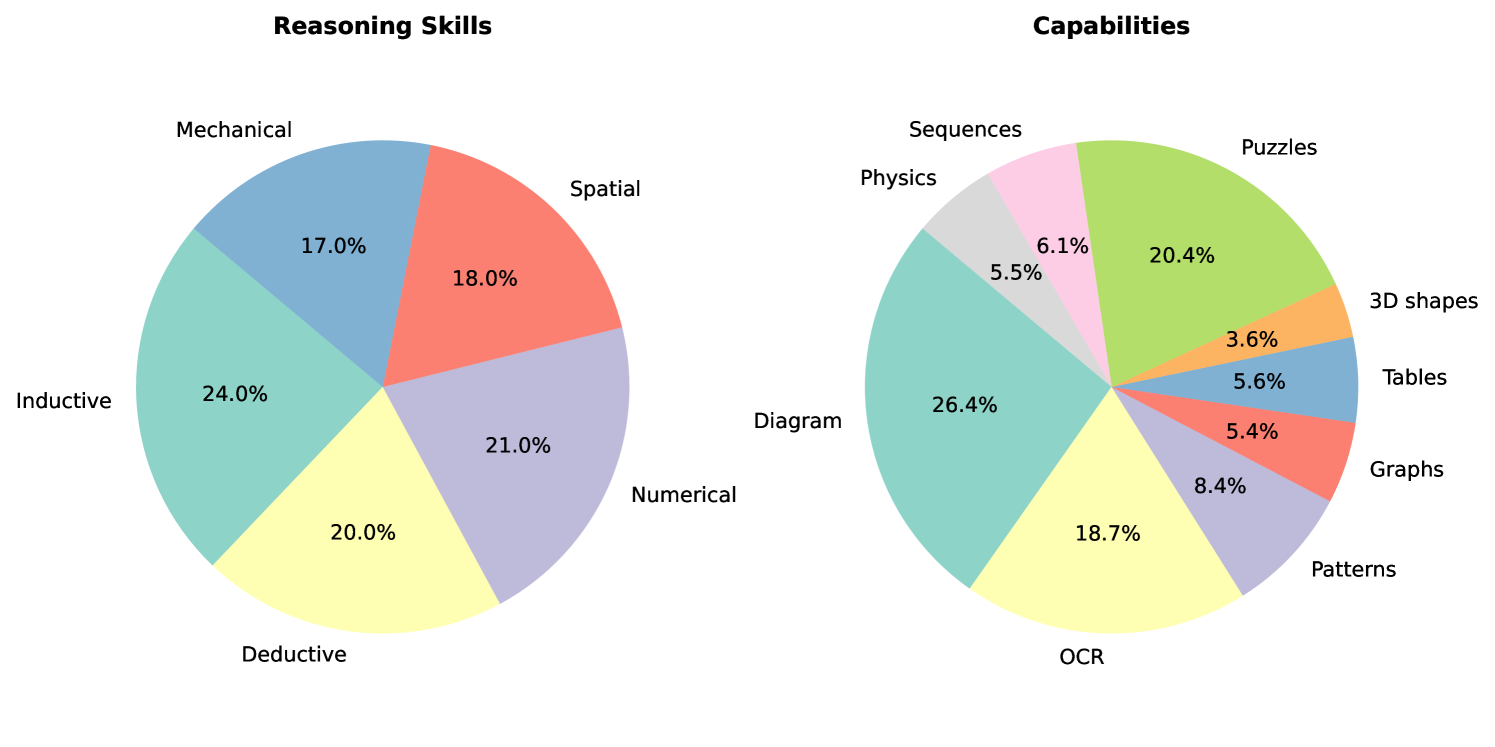
The image contains two pie charts side-by-side. The left pie chart represents "Reasoning Skills," and the right pie chart represents "Capabilities." Each slice of the pie charts indicates a specific skill or capability, along with its corresponding percentage.
### Components/Axes
**Left Pie Chart: Reasoning Skills**
* **Title:** Reasoning Skills
* **Categories:**
* Spatial (Salmon color)
* Numerical (Light Purple color)
* Deductive (Light Yellow color)
* Inductive (Light Green color)
* Mechanical (Light Blue color)
**Right Pie Chart: Capabilities**
* **Title:** Capabilities
* **Categories:**
* Diagram (Light Green color)
* OCR (Light Yellow color)
* Patterns (Light Purple color)
* Graphs (Salmon color)
* Tables (Light Blue color)
* 3D shapes (Orange color)
* Puzzles (Green color)
* Sequences (Pink color)
* Physics (Light Gray color)
### Detailed Analysis
**Reasoning Skills Pie Chart:**
* **Spatial:** 18.0% (Salmon color)
* **Numerical:** 21.0% (Light Purple color)
* **Deductive:** 20.0% (Light Yellow color)
* **Inductive:** 24.0% (Light Green color)
* **Mechanical:** 17.0% (Light Blue color)
**Capabilities Pie Chart:**
* **Diagram:** 26.4% (Light Green color)
* **OCR:** 18.7% (Light Yellow color)
* **Patterns:** 8.4% (Light Purple color)
* **Graphs:** 5.4% (Salmon color)
* **Tables:** 5.6% (Light Blue color)
* **3D shapes:** 3.6% (Orange color)
* **Puzzles:** 20.4% (Green color)
* **Sequences:** 6.1% (Pink color)
* **Physics:** 5.5% (Light Gray color)
### Key Observations
* In the Reasoning Skills pie chart, "Inductive" reasoning has the highest percentage (24.0%).
* In the Capabilities pie chart, "Diagram" understanding has the highest percentage (26.4%).
* "3D shapes" has the lowest percentage in the Capabilities pie chart (3.6%).
### Interpretation
The pie charts provide a visual representation of the distribution of different reasoning skills and capabilities. The "Reasoning Skills" chart indicates the relative importance or prevalence of various cognitive skills, with "Inductive" reasoning being the most prominent. The "Capabilities" chart highlights the distribution of different abilities, with "Diagram" understanding being the most significant. The data suggests a focus on inductive reasoning and diagrammatic understanding, while skills like understanding 3D shapes may be less emphasized or prevalent. The charts can be used to identify areas of strength and weakness in a particular context, such as education, training, or job requirements.