## Pie Charts: Reasoning Skills and Capabilities
### Overview
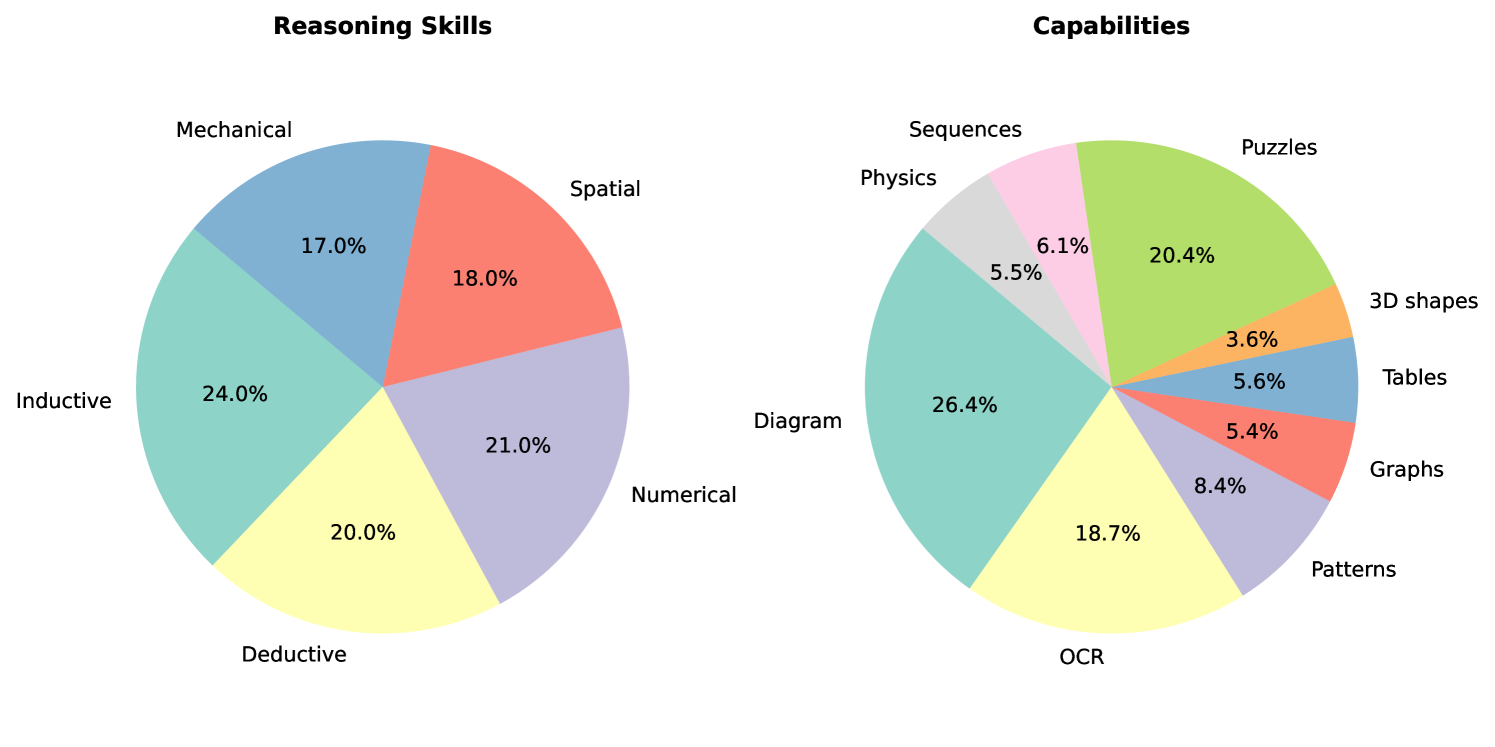
This image displays two side-by-side pie charts representing data distributions. The left chart is titled "Reasoning Skills" and contains five categories. The right chart is titled "Capabilities" and contains nine categories. Both charts use percentage values to indicate the proportion of each category relative to the whole.
### Components/Axes
* **Left Chart (Reasoning Skills):** A circular chart divided into five distinct slices, each labeled with a category name and a percentage value.
* **Right Chart (Capabilities):** A circular chart divided into nine distinct slices, each labeled with a category name and a percentage value.
* **Legend:** There is no separate legend; labels are placed directly adjacent to their corresponding slices.
### Detailed Analysis
#### Left Chart: Reasoning Skills
The chart is divided into five segments. Moving clockwise starting from the top:
1. **Mechanical:** 17.0% (Blue slice, top-left quadrant)
2. **Spatial:** 18.0% (Red-orange slice, top-right quadrant)
3. **Numerical:** 21.0% (Purple slice, bottom-right quadrant)
4. **Deductive:** 20.0% (Yellow slice, bottom-center)
5. **Inductive:** 24.0% (Teal slice, left-center)
*Trend Verification:* The distribution is relatively balanced, with "Inductive" being the largest segment (24.0%) and "Mechanical" being the smallest (17.0%). The difference between the largest and smallest segment is 7.0 percentage points.
#### Right Chart: Capabilities
The chart is divided into nine segments. Moving clockwise starting from the top:
1. **Puzzles:** 20.4% (Light green slice, top-right)
2. **3D shapes:** 3.6% (Orange slice, right-center)
3. **Tables:** 5.6% (Blue slice, right-center)
4. **Graphs:** 5.4% (Red-orange slice, right-center)
5. **Patterns:** 8.4% (Purple slice, bottom-right)
6. **OCR:** 18.7% (Yellow slice, bottom-center)
7. **Diagram:** 26.4% (Teal slice, left-center)
8. **Physics:** 5.5% (Grey slice, top-left)
9. **Sequences:** 6.1% (Pink slice, top-left)
*Trend Verification:* This chart shows a high variance in distribution. "Diagram" is the dominant category (26.4%), followed closely by "Puzzles" (20.4%) and "OCR" (18.7%). The remaining six categories are significantly smaller, ranging from 3.6% to 8.4%.
### Key Observations
* **Color Consistency:** There appears to be a deliberate color-coding scheme shared between the two charts. For example, the "Teal" slice represents the largest category in both charts ("Inductive" at 24.0% and "Diagram" at 26.4%). Similarly, the "Yellow" slice represents the second-largest category in both charts ("Deductive" at 20.0% and "OCR" at 18.7%).
* **Granularity:** The "Capabilities" chart is significantly more granular than the "Reasoning Skills" chart, suggesting that "Capabilities" may be a breakdown of specific task types, whereas "Reasoning Skills" represents broader cognitive domains.
* **Outliers:** In the "Capabilities" chart, "3D shapes" is the smallest category at 3.6%, which is roughly 7.3 times smaller than the largest category ("Diagram").
### Interpretation
The data likely represents the performance or task distribution of an Artificial Intelligence model across different benchmarks.
* **Cognitive Mapping:** The shared color scheme suggests a mapping between the "Reasoning Skills" and "Capabilities." For instance, the "Teal" category (Inductive/Diagram) and "Yellow" category (Deductive/OCR) are the most prominent in both charts, implying that the model is most heavily tested or most proficient in these areas.
* **Task Complexity:** The "Capabilities" chart suggests that the model handles a wide variety of specific input types (e.g., Tables, Graphs, Physics, Sequences), but the majority of its "capability" is concentrated in visual/spatial processing (Diagrams, Puzzles, OCR).
* **Peircean Investigative Note:** The grouping of "Diagram," "Puzzles," and "OCR" as the top three categories (totaling 65.5% of the "Capabilities" chart) indicates that this model is likely optimized for multimodal or visual-reasoning tasks rather than purely textual or mathematical ones. The "Reasoning Skills" chart acts as a high-level summary of the cognitive faculties required to perform the tasks detailed in the "Capabilities" chart.